
Locations: See Where Your Team Works
Locations shows you where your employees actually work — in the office, remotely, or a mix of both — without badges, manual check-ins, or timesheets. Controlio classifies every tracked workday as Office, Remote, or Hybrid automatically, based on the networks each computer connects from, and breaks down active time, productive time, and productivity scores by location. Time from networks that can't be classified is reported separately as Unassigned, so nothing is lost.
Use Locations to verify hybrid work policies, compare productivity across work environments, spot attendance trends, and back return-to-office decisions with real data.
Locations requires the Controlio agent version 1.3.71 or later for Windows, or 1.2.115 or later for Mac.
How Controlio Detects Locations
The Controlio agent logs the public network (IP subnet) each computer connects from. Controlio then classifies these networks automatically — no setup required:
Office networks. Controlio analyzes the last 7 days of activity. If on any day at least 3 + 1% of your account's computers connect from the same subnet, that subnet is marked as Office. A company with several offices simply gets several Office networks.
Remote networks. If a subnet never reaches the office threshold during the 7-day window — a home Wi-Fi network, a mobile hotspot, a coffee shop — it is marked as Remote.
Estimated networks are marked with a sparkle icon in reports. Estimates may change over time as your office infrastructure changes, and every change is stored historically, so past reports stay accurate. You can override any estimate manually — see Managing Networks below.
How Workdays Are Classified
Each user's calendar day (in your account's timezone) is classified by where their active time was spent:
A workday counts as Office or Remote only if that location accounts for at least the configured share — 80% by default — of the day's combined office and remote time. If the day is split between the office and remote work and neither side dominates, the day is classified as Hybrid.
Only Office and Remote time is compared when classifying a day: time tracked while the computer was offline, and time from networks that have no location type (reported as Unassigned), is not part of the calculation.
Locations reports update throughout the day as new data arrives from computers, and any change you make to network settings recalculates all Locations reports retrospectively.
Locations on the Dashboard
Open Dashboard → Locations for an at-a-glance view of your whole team:
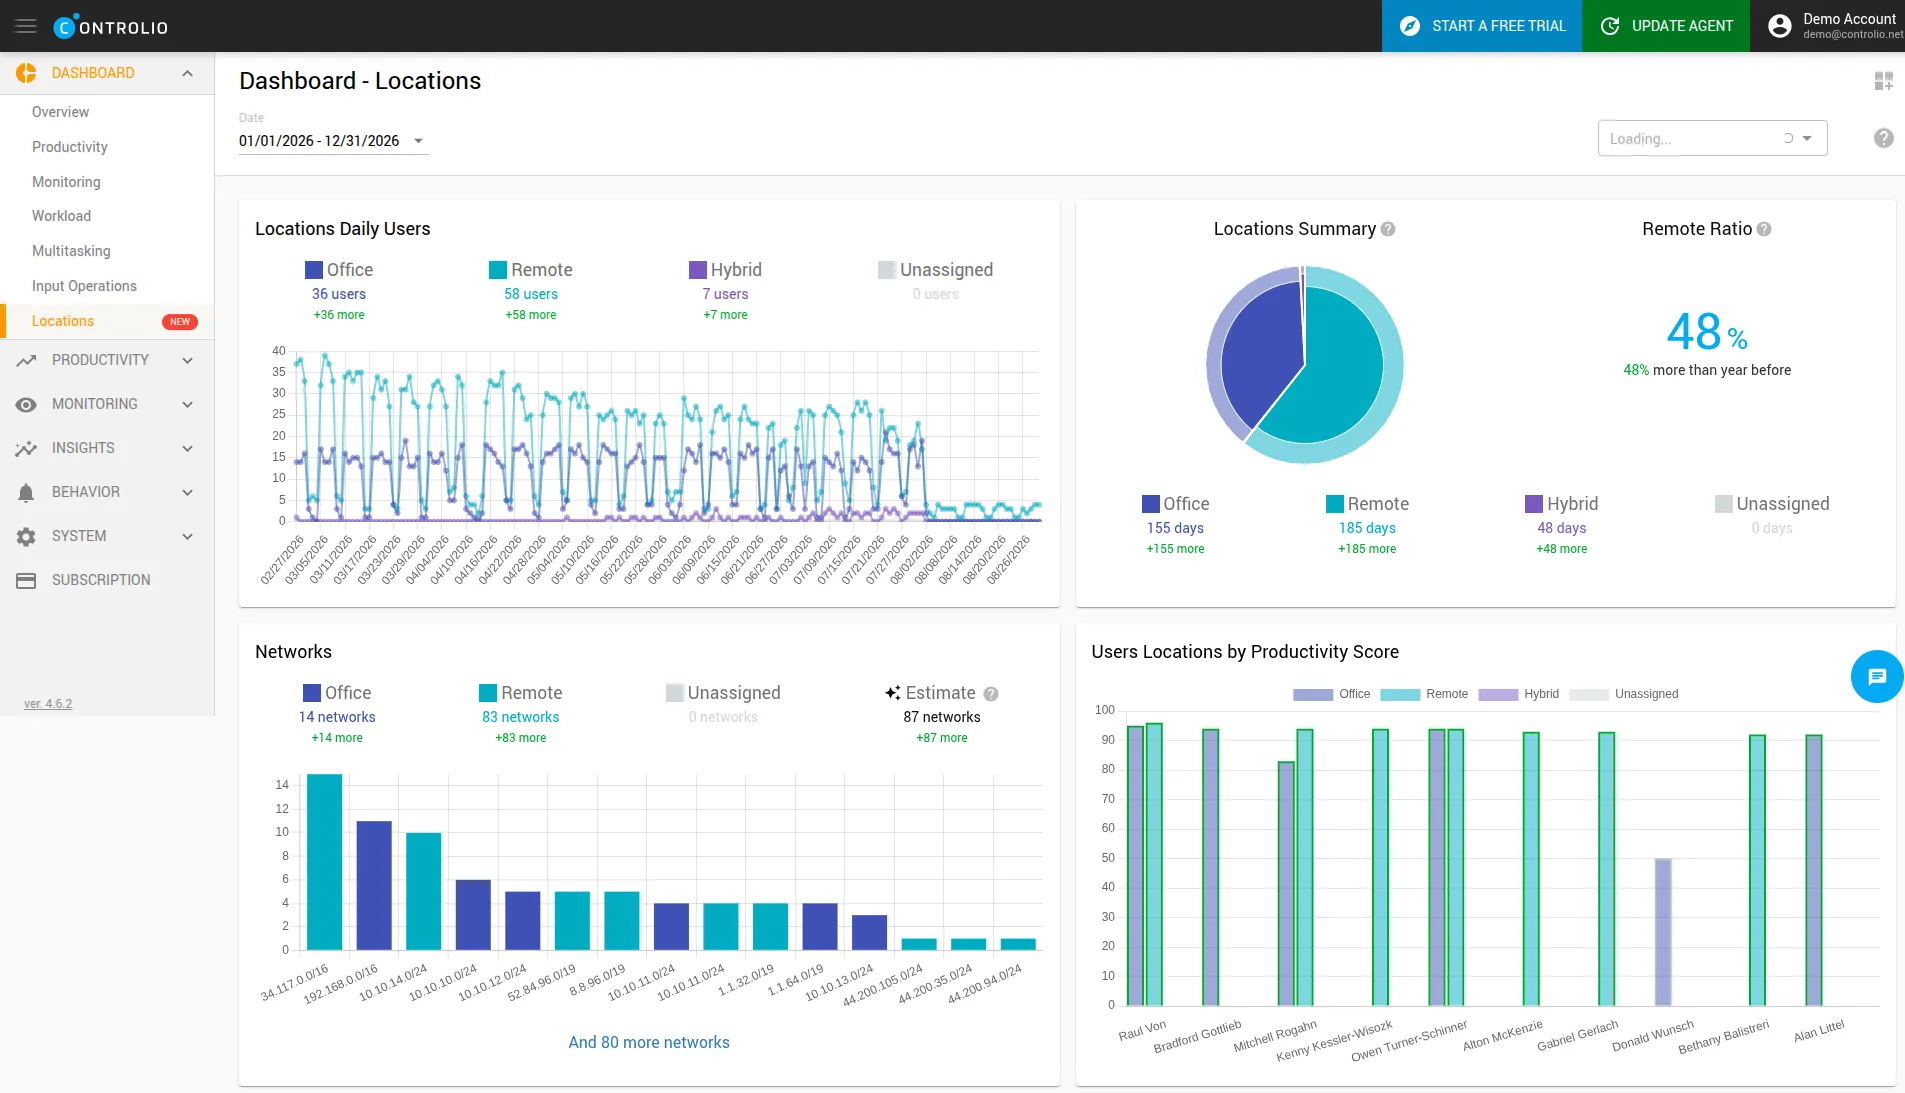
Locations Daily Users charts how many people worked from the office, remotely, or hybrid on each day of the selected period. Locations Summary totals Office, Remote, Hybrid, and Unassigned days, while Remote Ratio shows the share of remote workdays — a single number to track your remote-work trend.
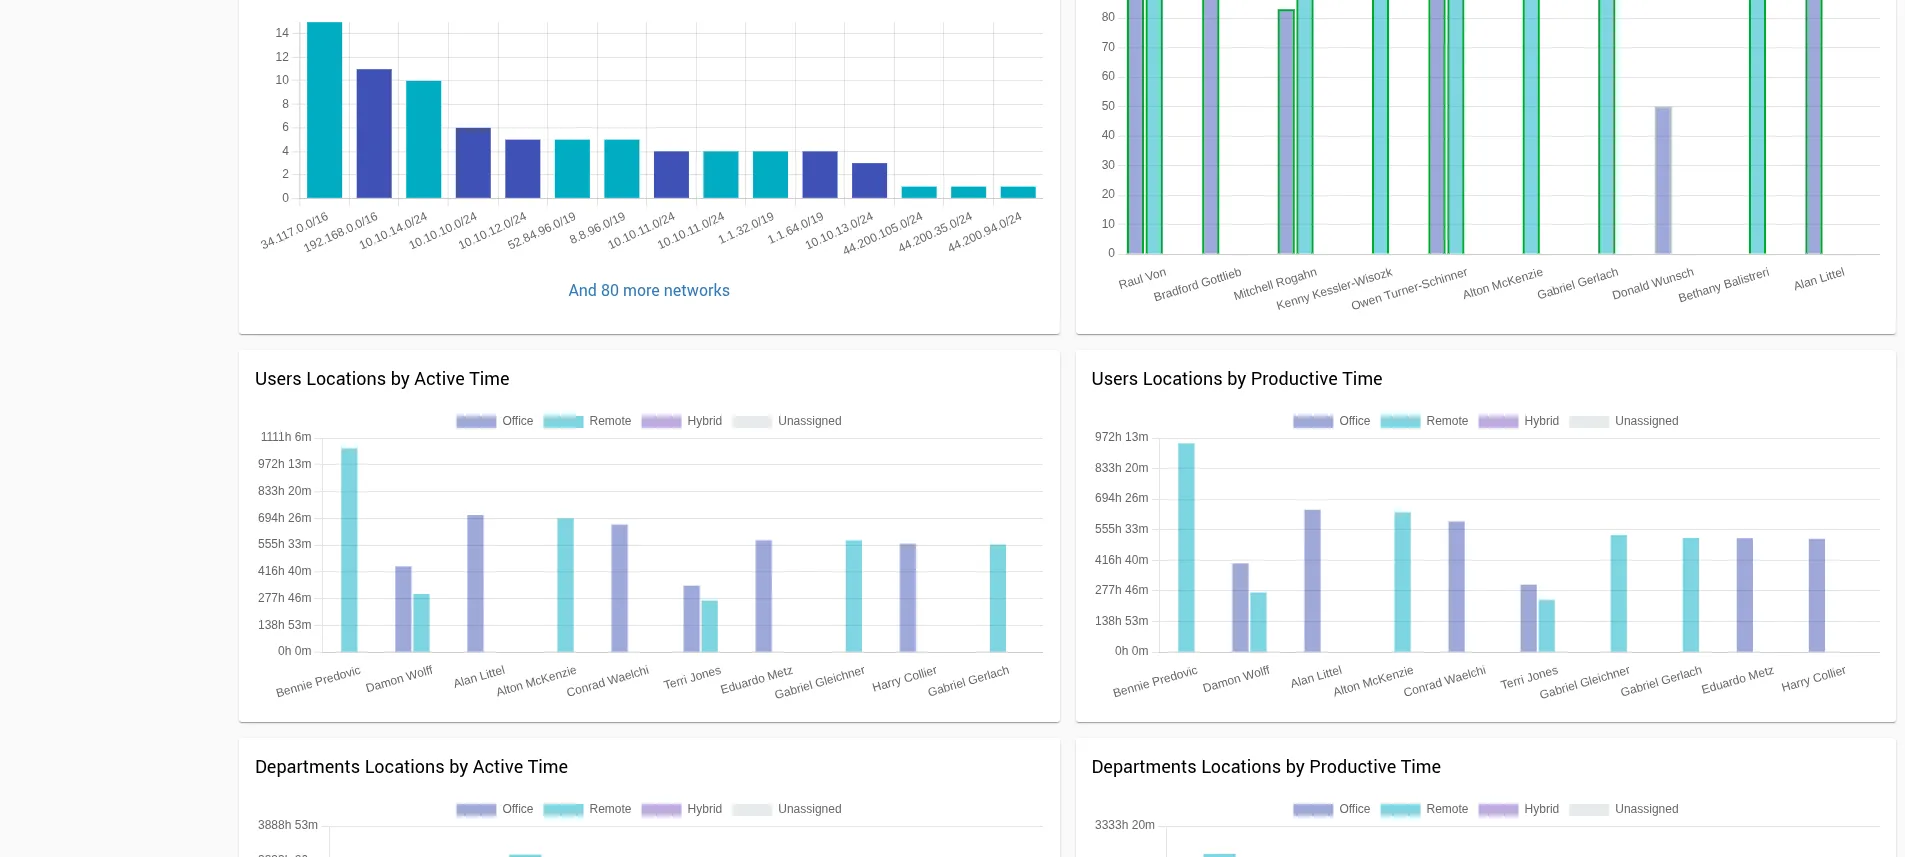
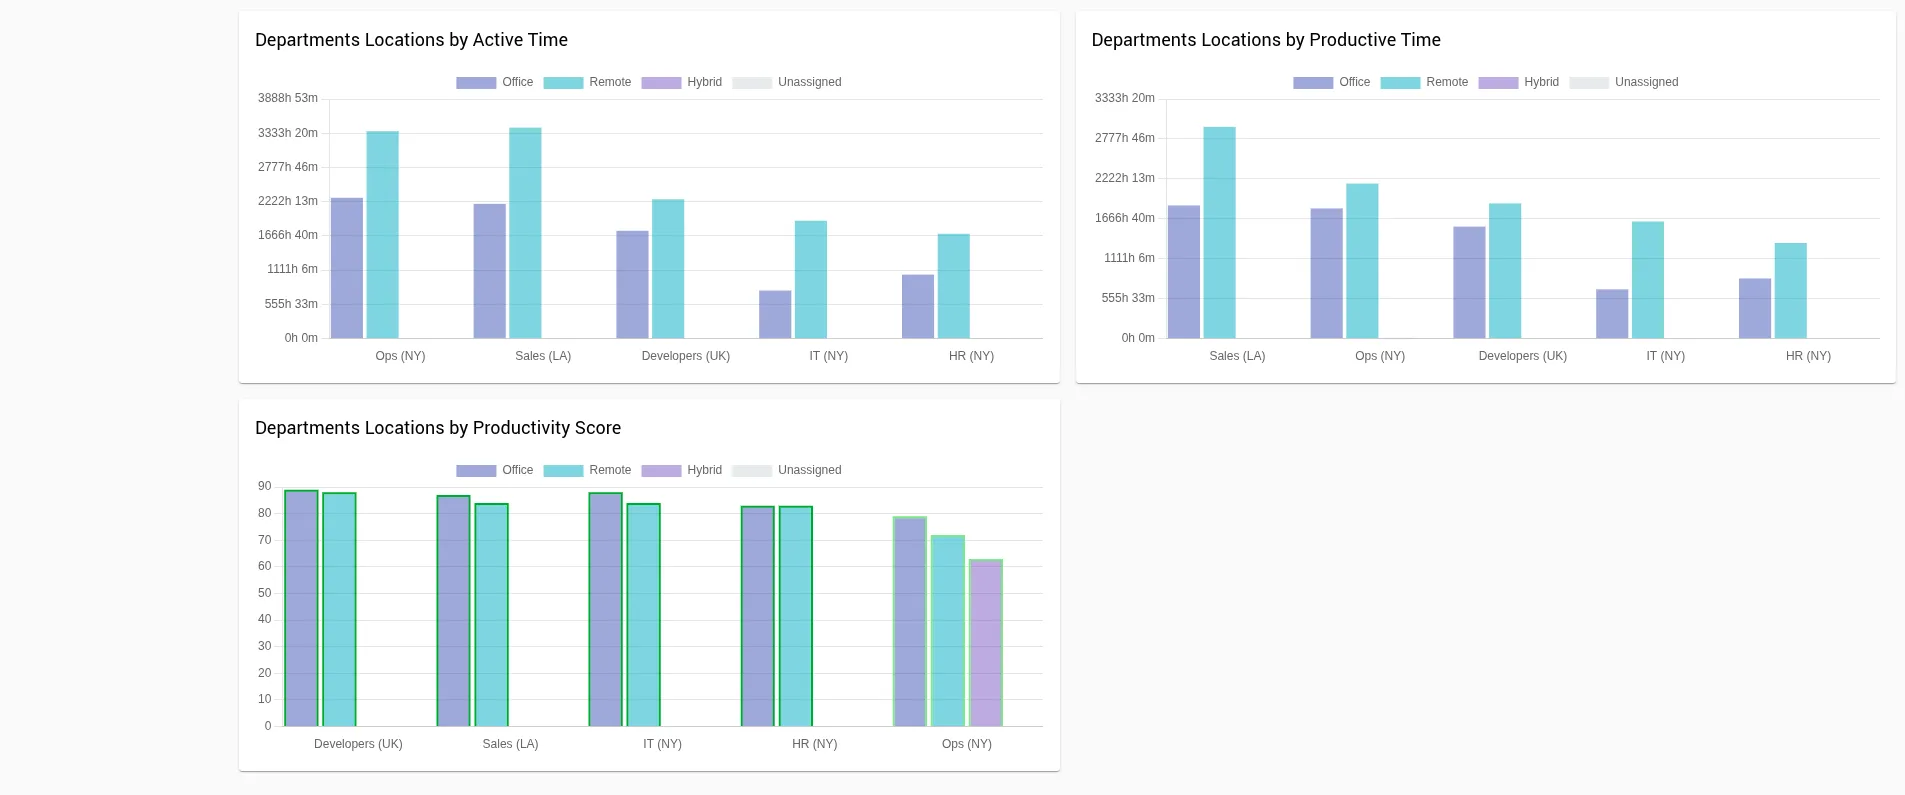
The Networks widget counts your detected Office and Remote networks and shows how many were estimated automatically. The Users Locations widgets compare each person's active time, productive time, and productivity score by location, and the Departments Locations widgets roll the same comparison up to the department level — ideal for planning office space, seating, and scheduling.
The Locations Report
For deeper analysis, open Insights → Locations. The report has five tabs — Overview, Users, Departments, Days, and Networks — and shared controls: a date range picker, a location filter, a user and department filter, search, and CSV export.
Overview
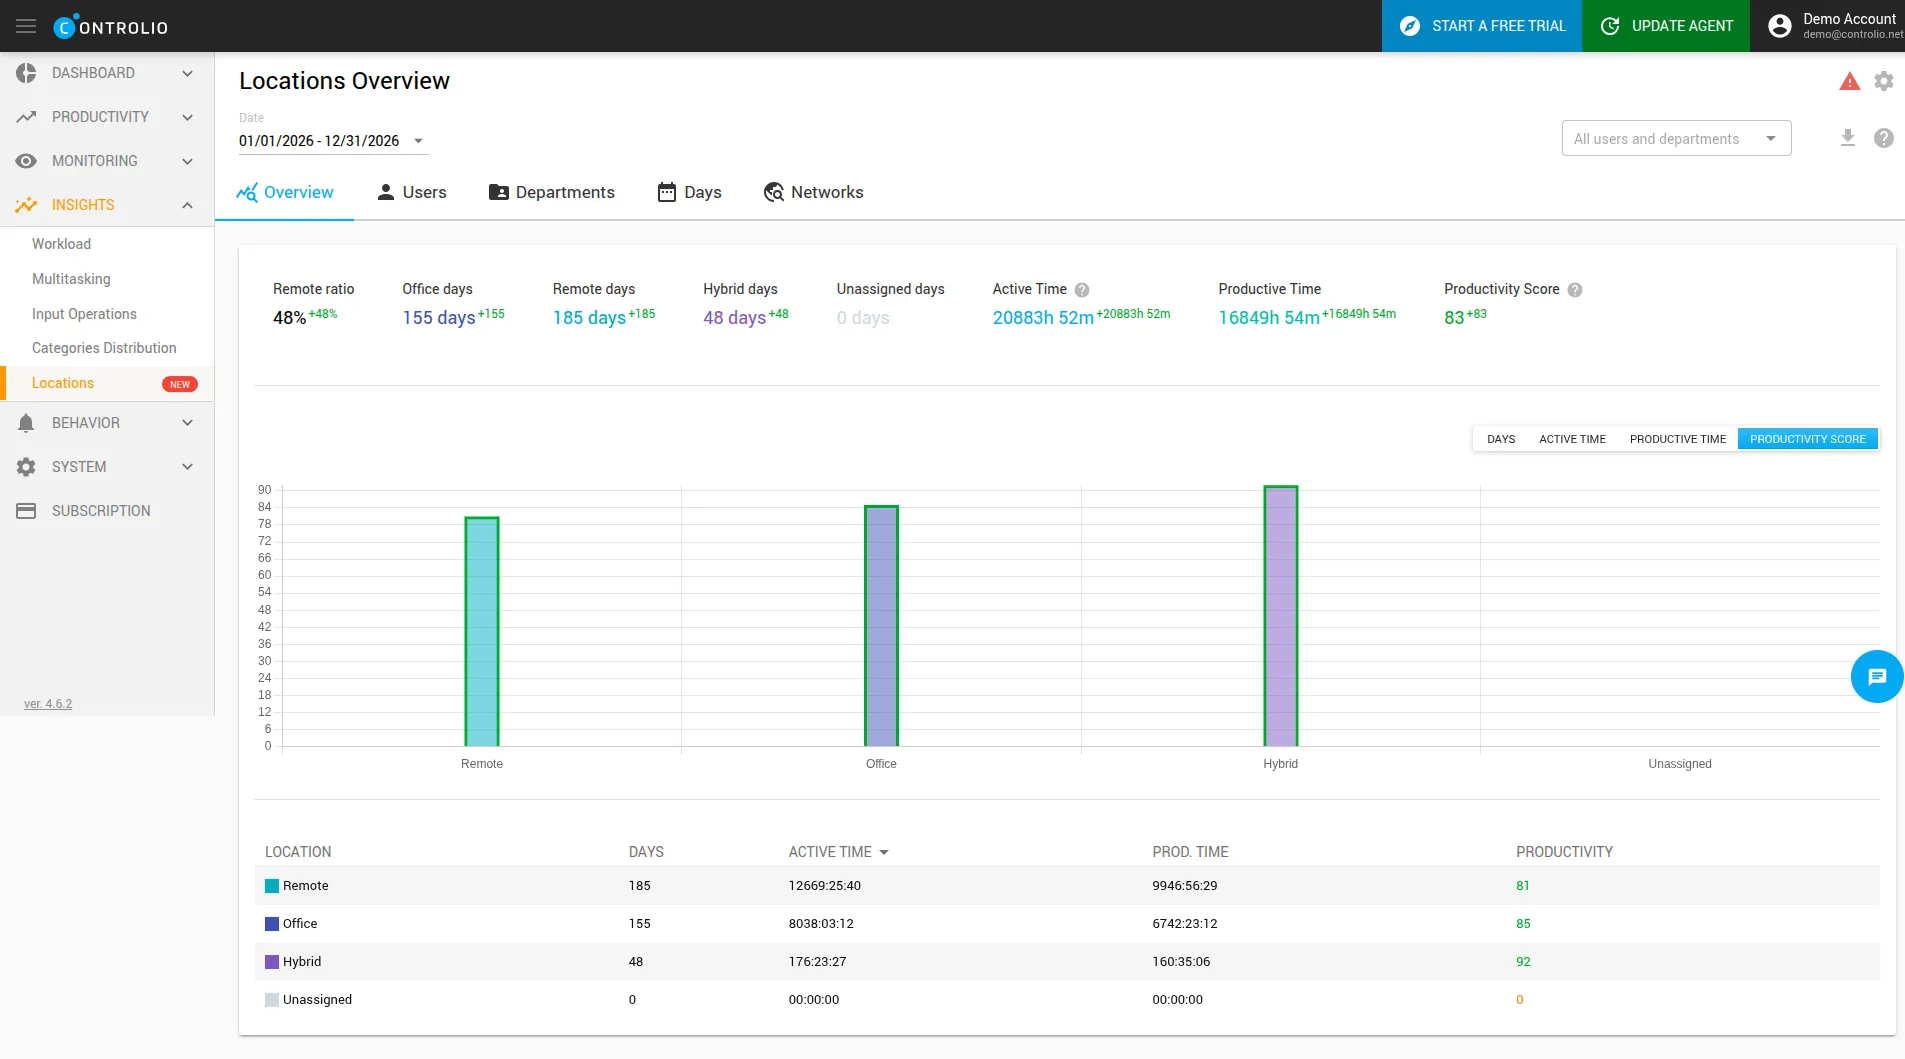
The Overview tab summarizes the period: remote ratio, Office/Remote/Hybrid/Unassigned days, total active and productive time. Switch the chart between Days, Active Time, Productive Time, and Productivity Score to compare locations side by side.
Users
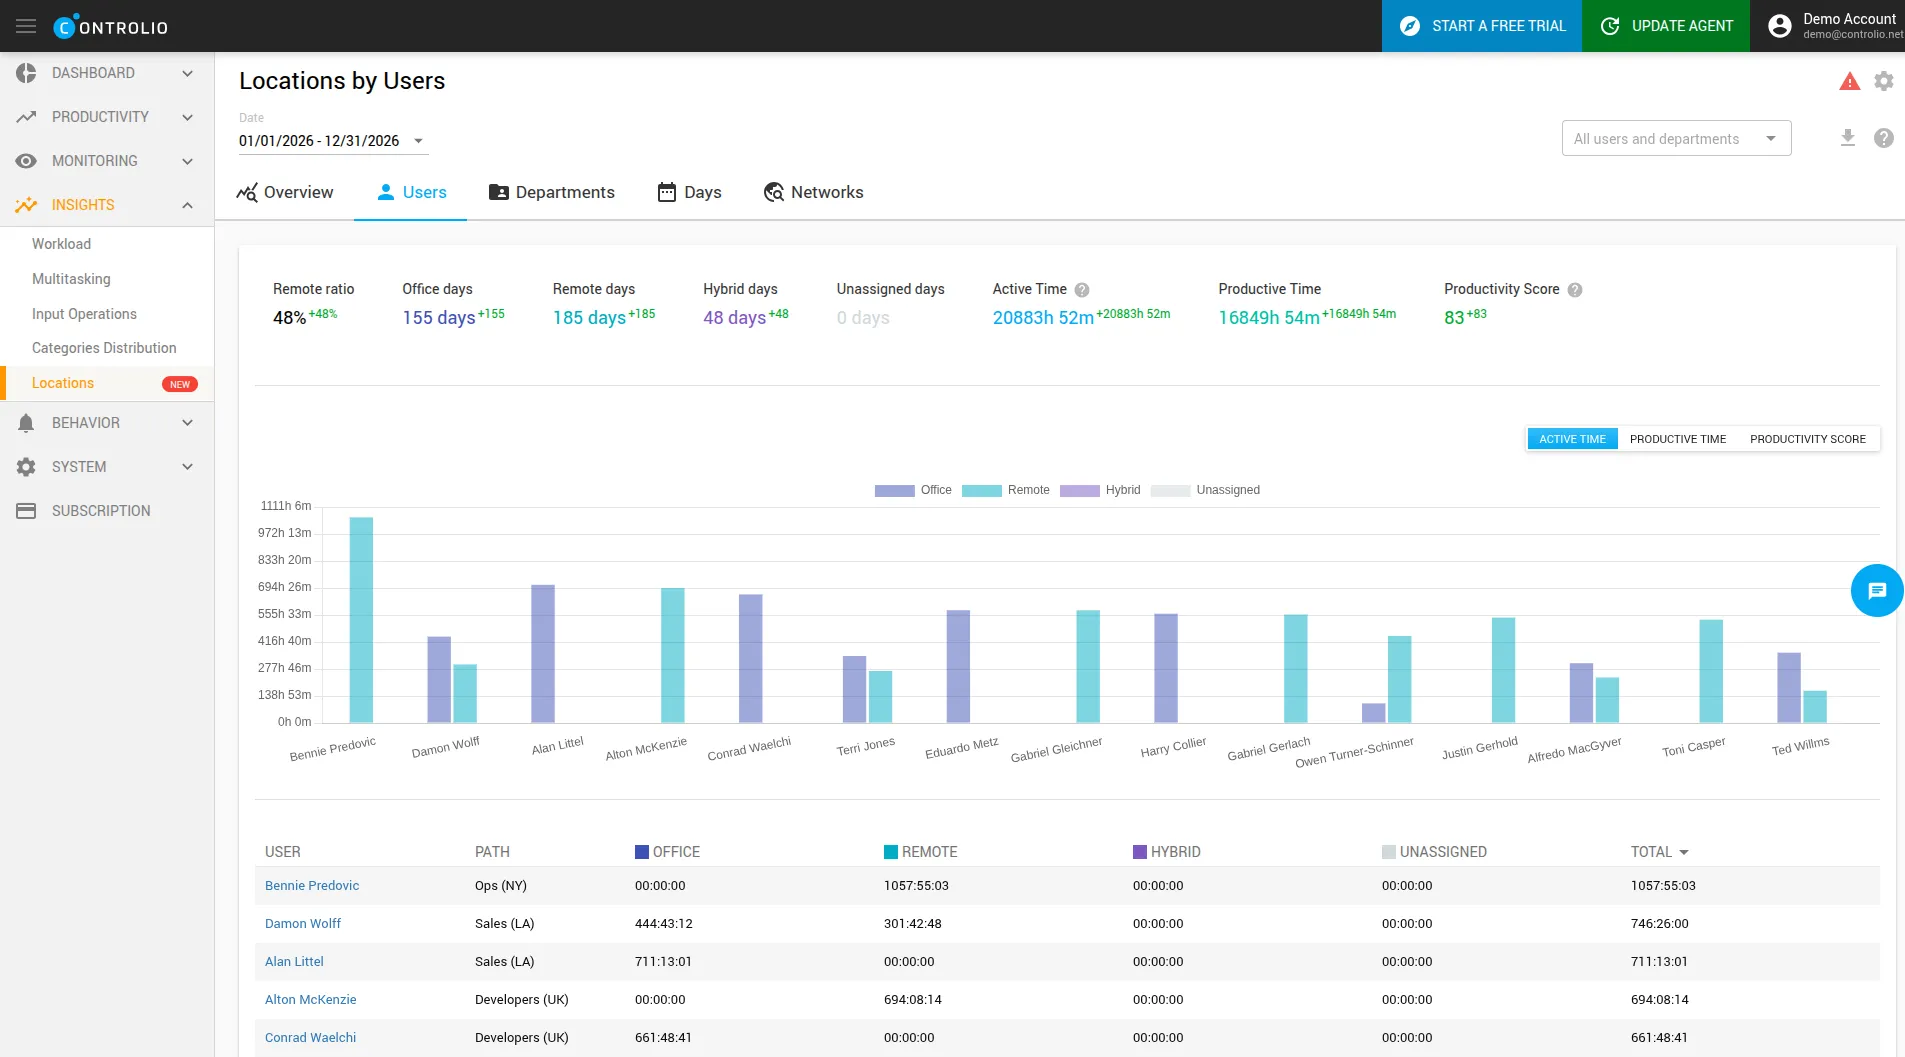
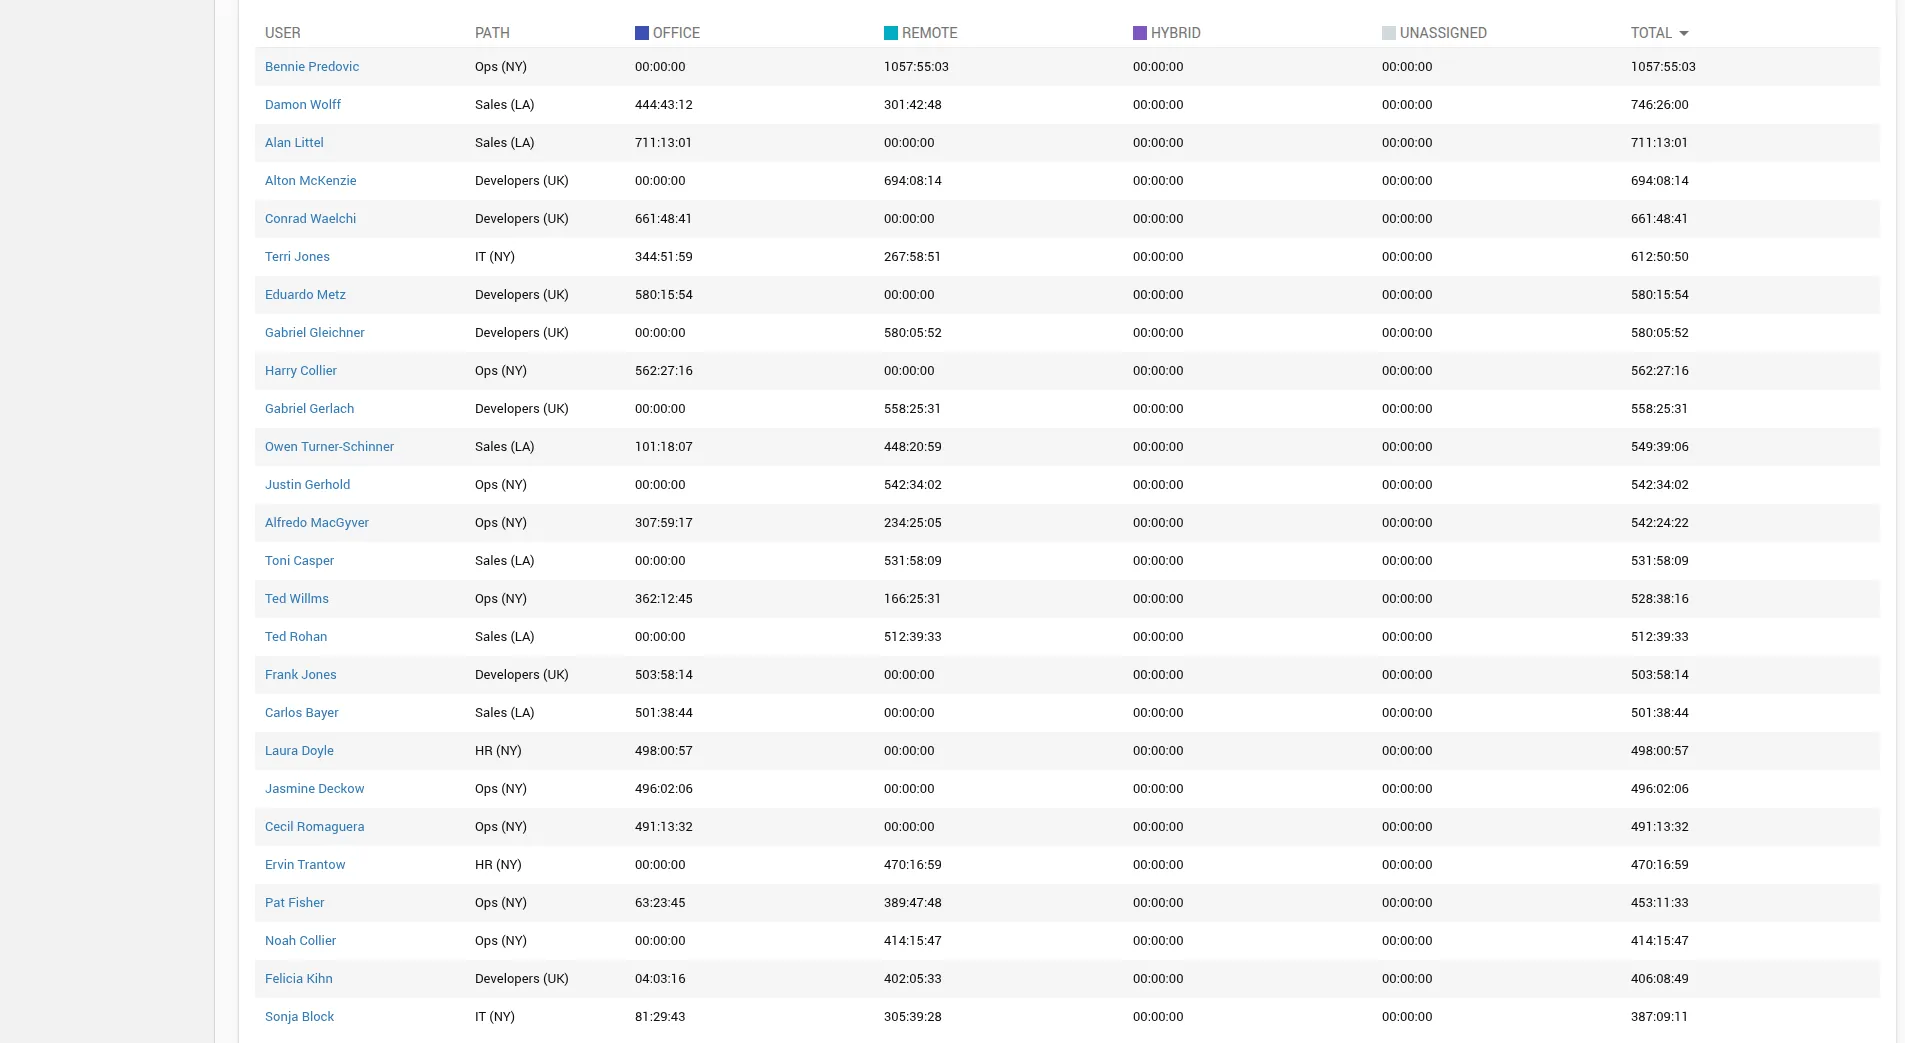
The Users tab shows each employee's active time, productive time, and productivity score broken down by location. The table below lists exact Office, Remote, Hybrid, and Unassigned time per person — click a name to drill into that user's reports.
Departments
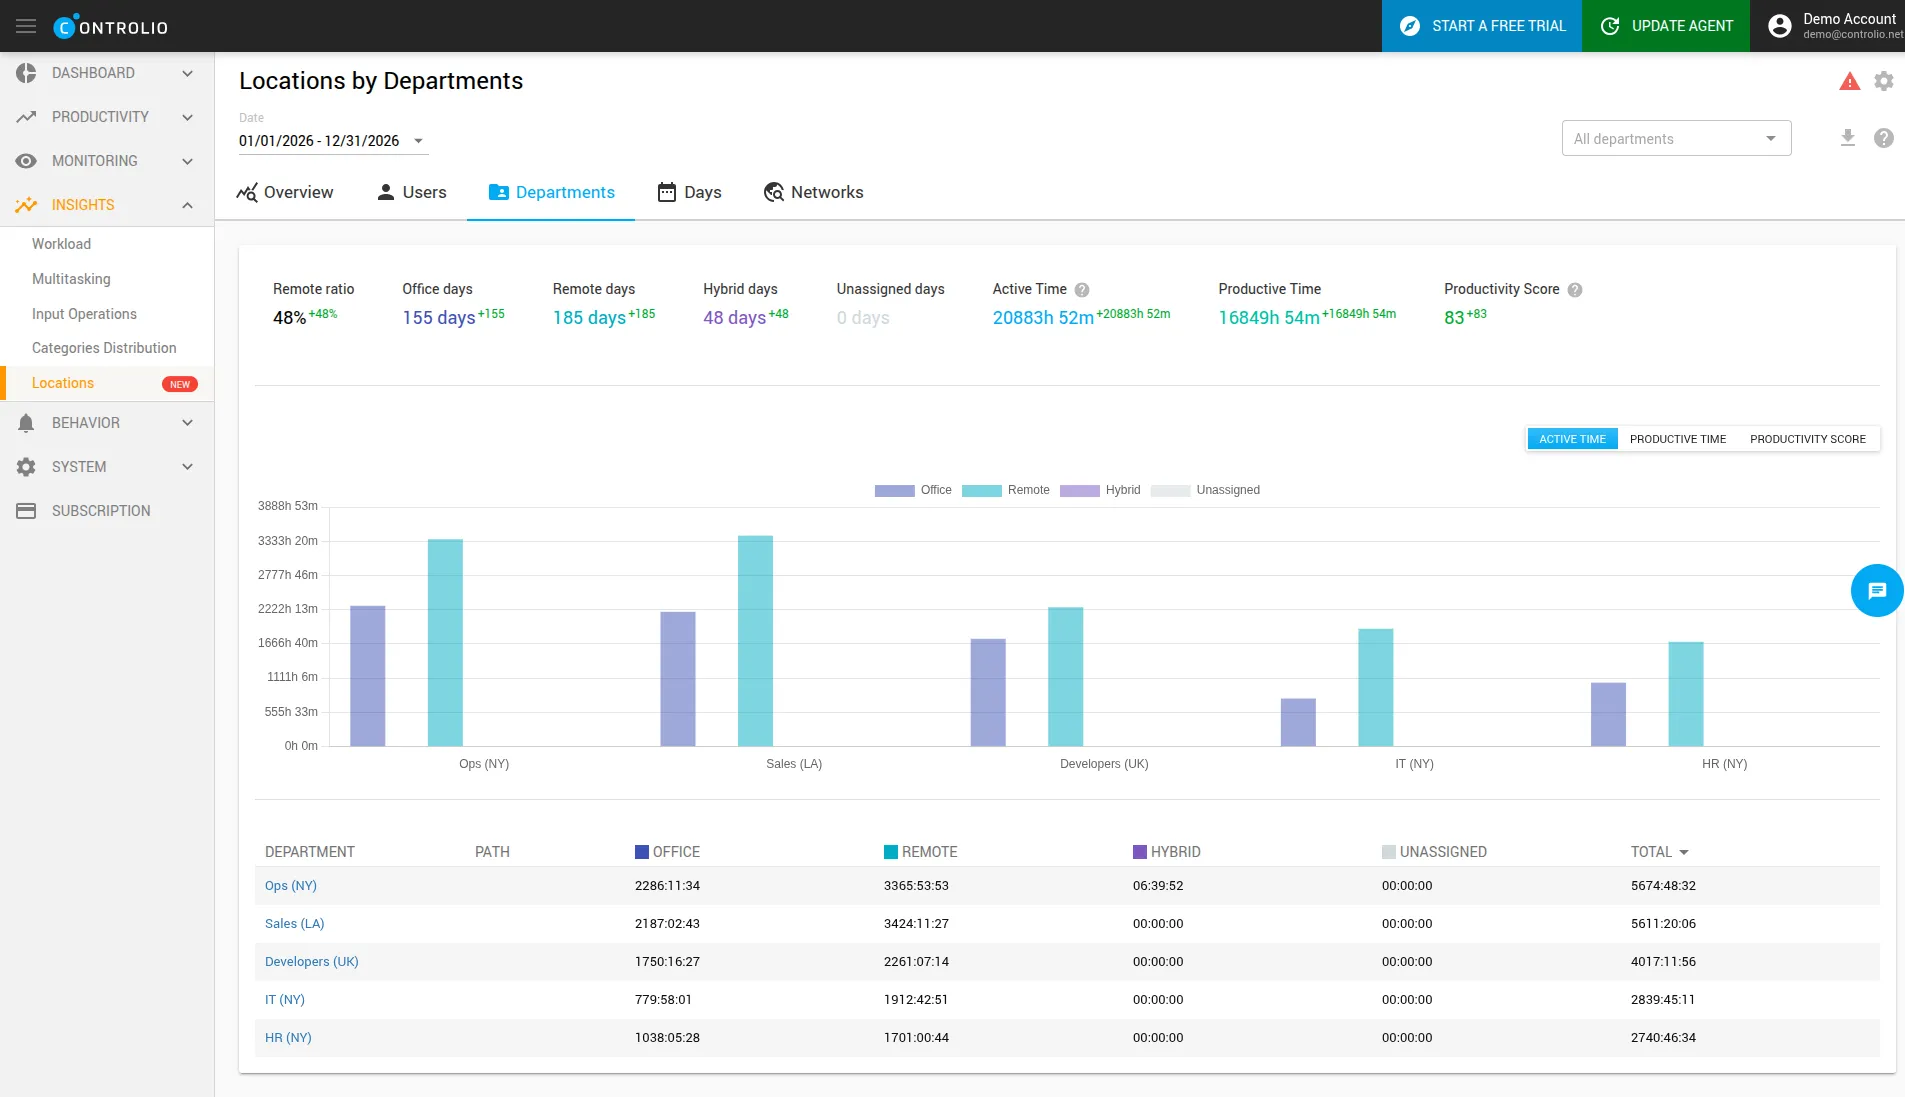
The Departments tab aggregates the same metrics per department, so you can see which teams are mostly in-office, which are mostly remote, and how their productivity compares.
Days
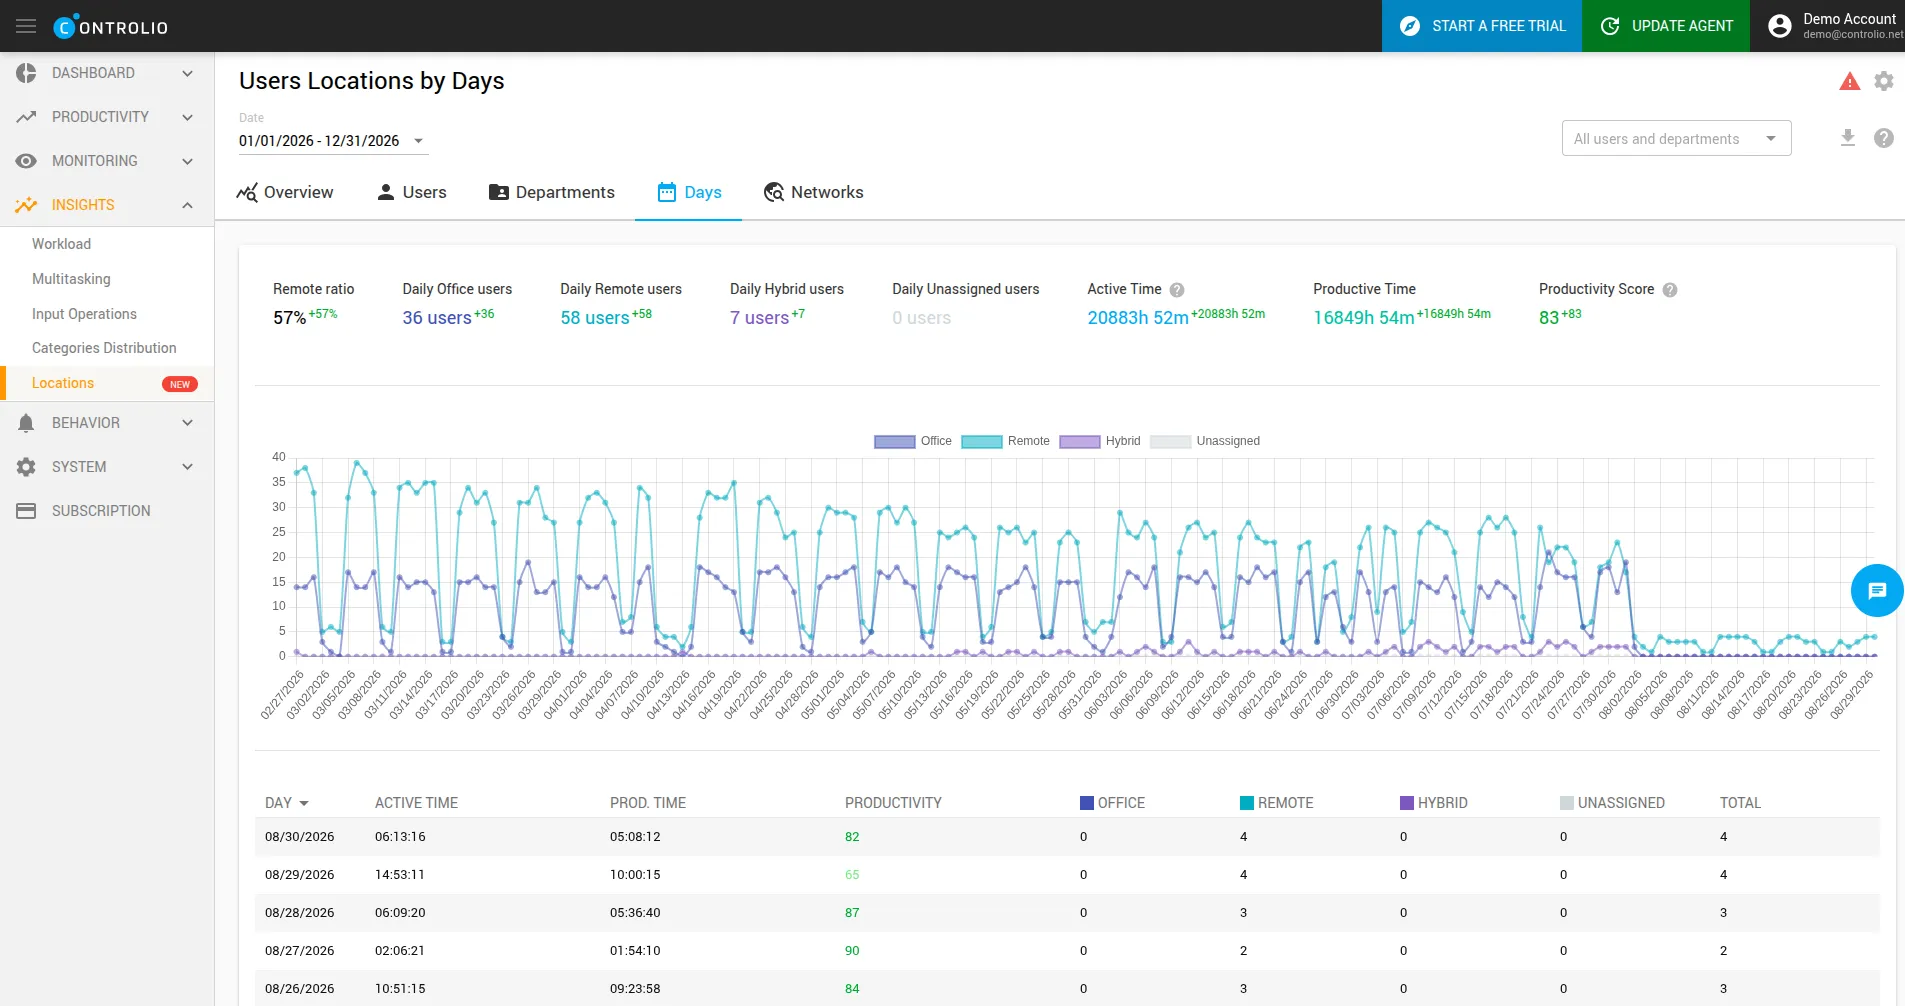
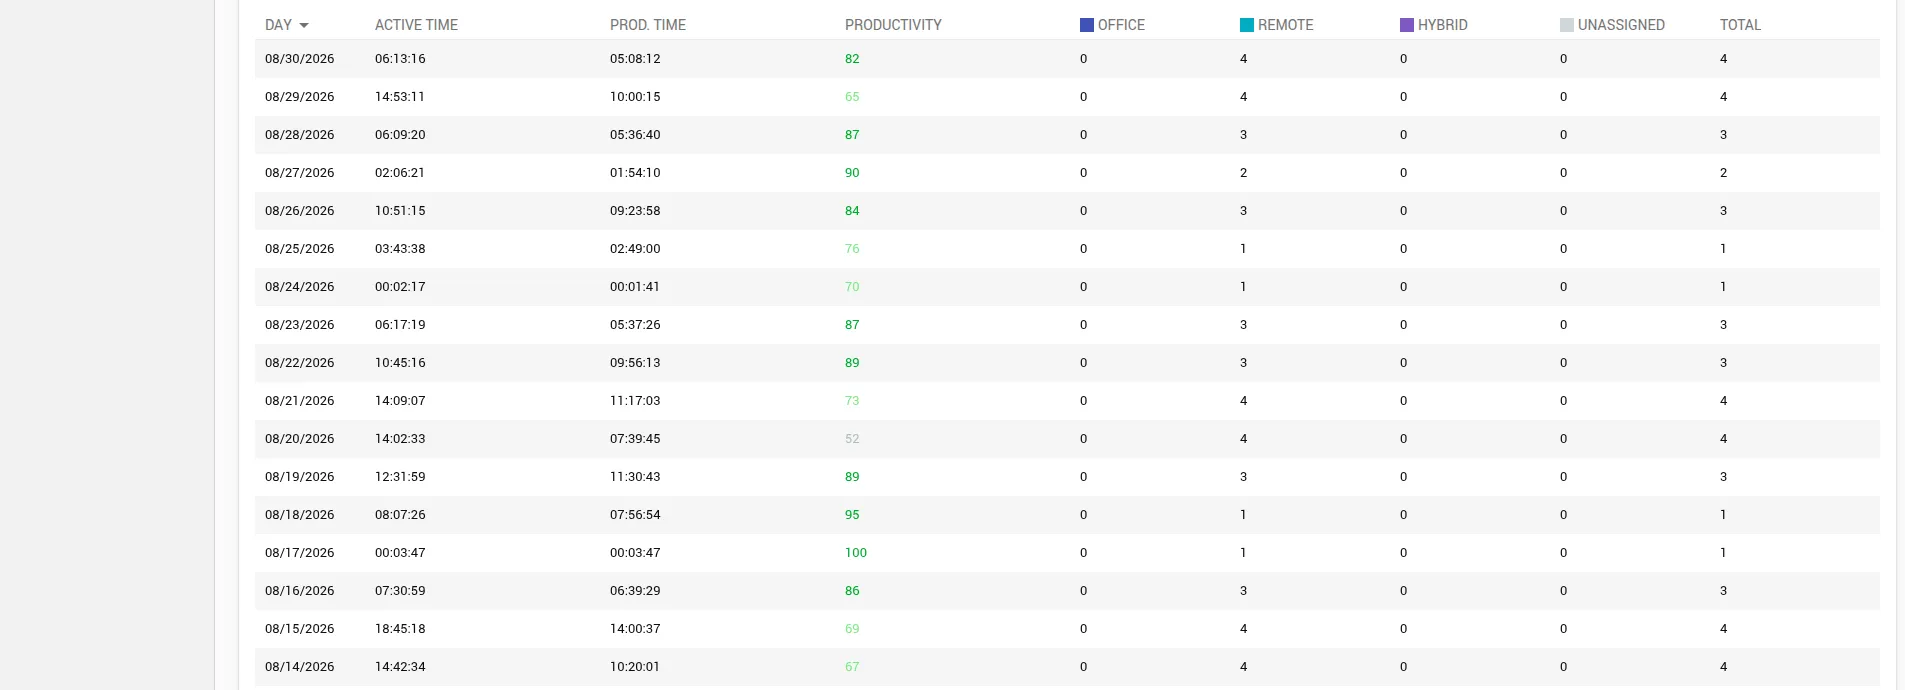
The Days tab is your attendance trend view: how many people worked from each location on every day of the period, with daily active time, productive time, and productivity score in the table below. Use it to spot patterns — quiet Fridays, busy office Tuesdays — and to plan capacity.
Networks
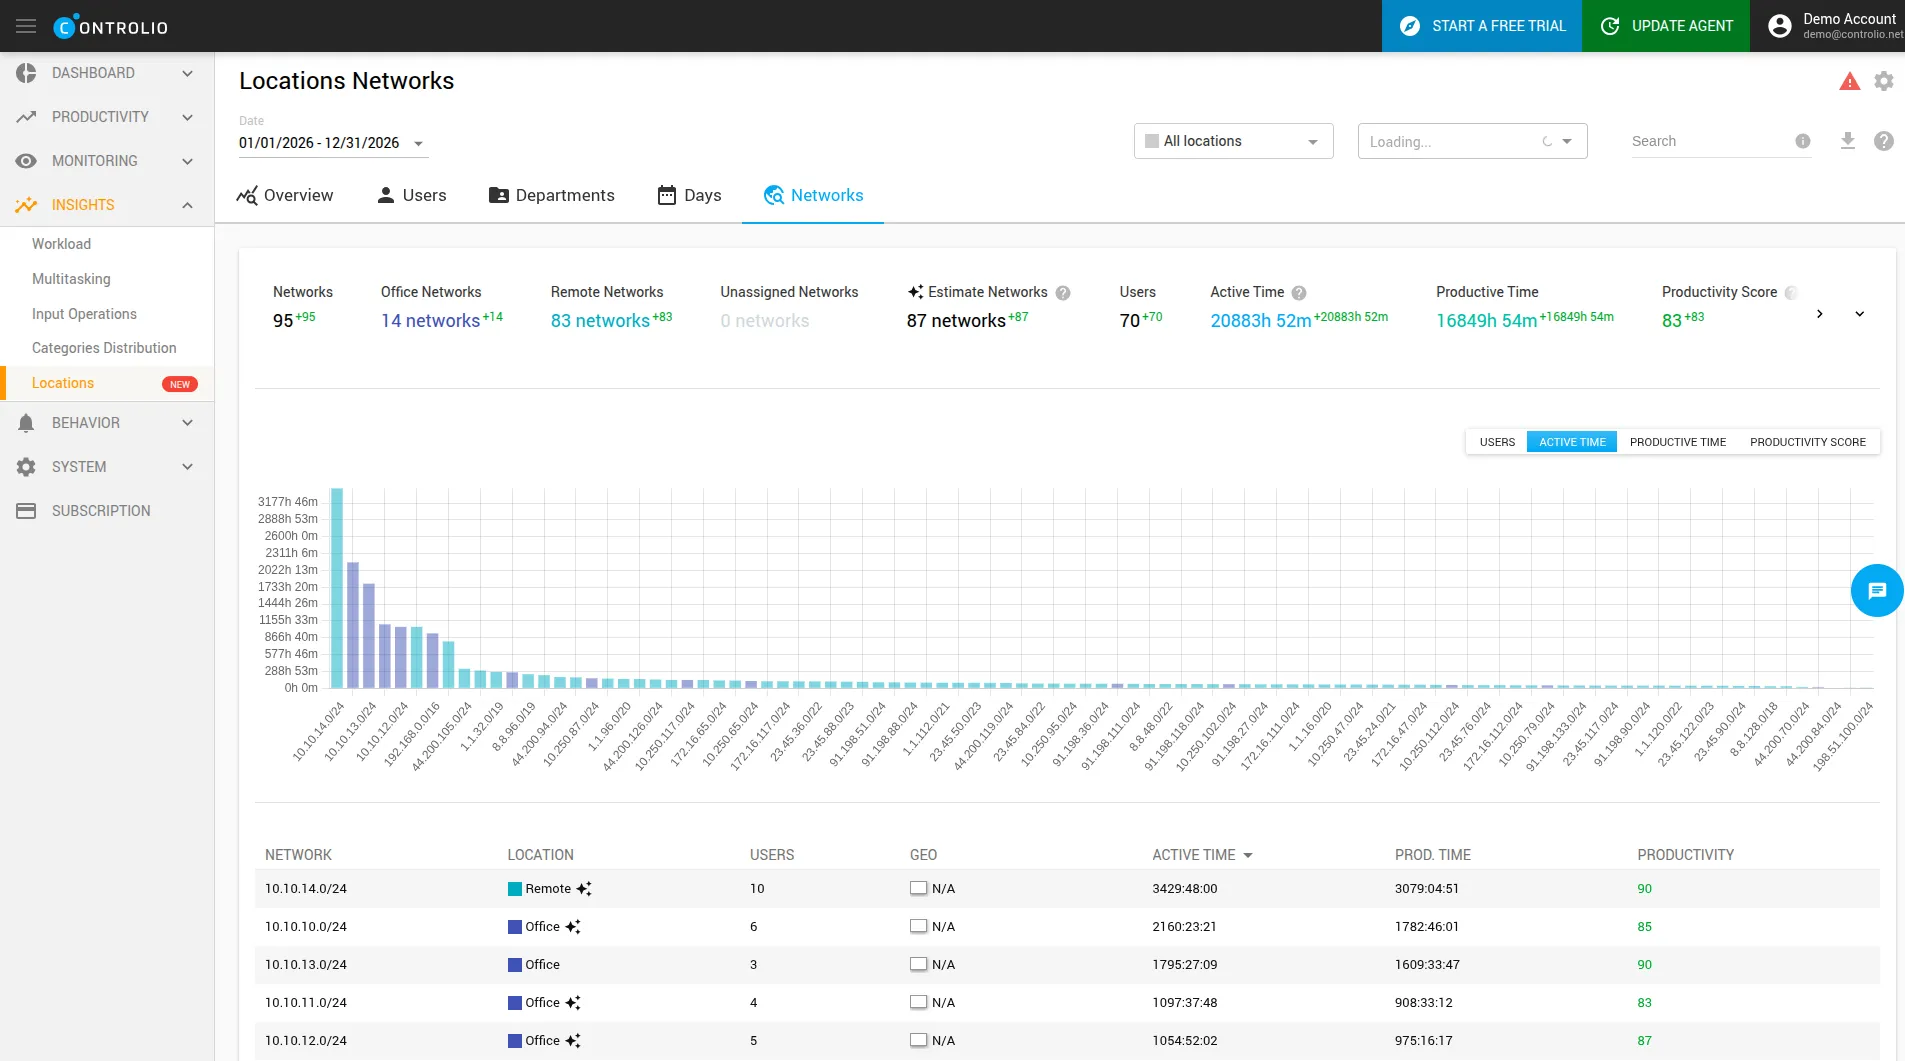
The Networks tab lists every network your computers connected from: its subnet, assigned location type, number of users, geo label (country and city, where available), and the active time, productive time, and productivity score recorded on it. Networks estimated automatically are marked with a sparkle icon.
Managing Networks and Settings
Locations works out of the box, but everything is under your control in System → Locations.
General Settings
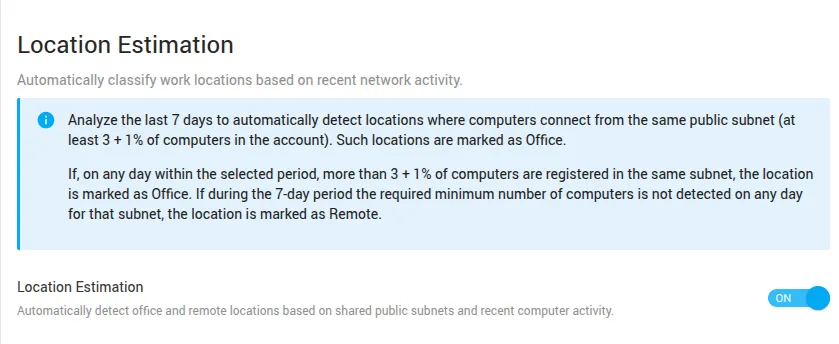
Location Estimation toggles automatic detection of Office and Remote networks. It is on by default; if you switch it off, networks you haven't mapped manually become Unassigned.
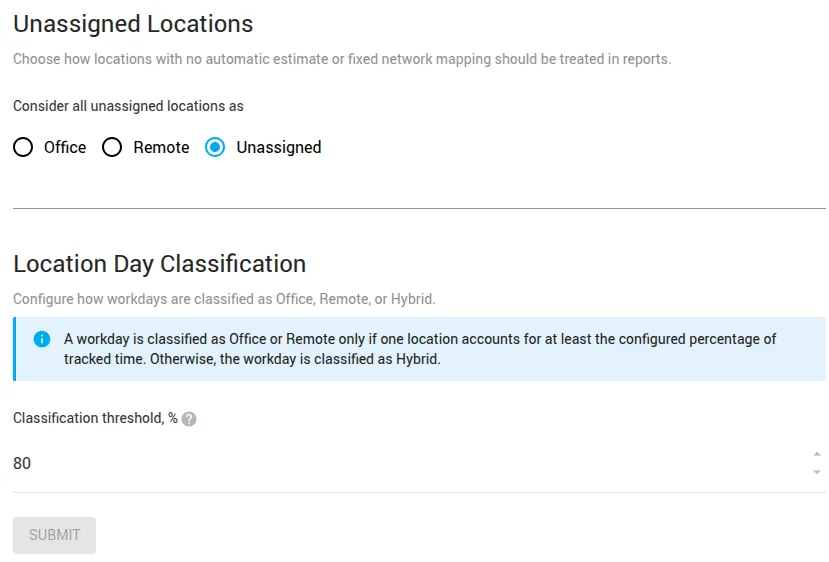
Unassigned Locations lets you choose how time from unmapped networks is reported: keep it as Unassigned, or count it as Office or Remote.
Location Day Classification sets the threshold used to classify workdays. The threshold is applied to the sum of the day's Office and Remote time only — offline and Unassigned time is not taken into consideration. With the default of 80%, a day counts as Office or Remote only when that location makes up at least 80% of the combined Office + Remote time; otherwise the day is Hybrid. Lower the threshold to classify more days as pure Office or Remote, or raise it to be stricter.
Network Mapping
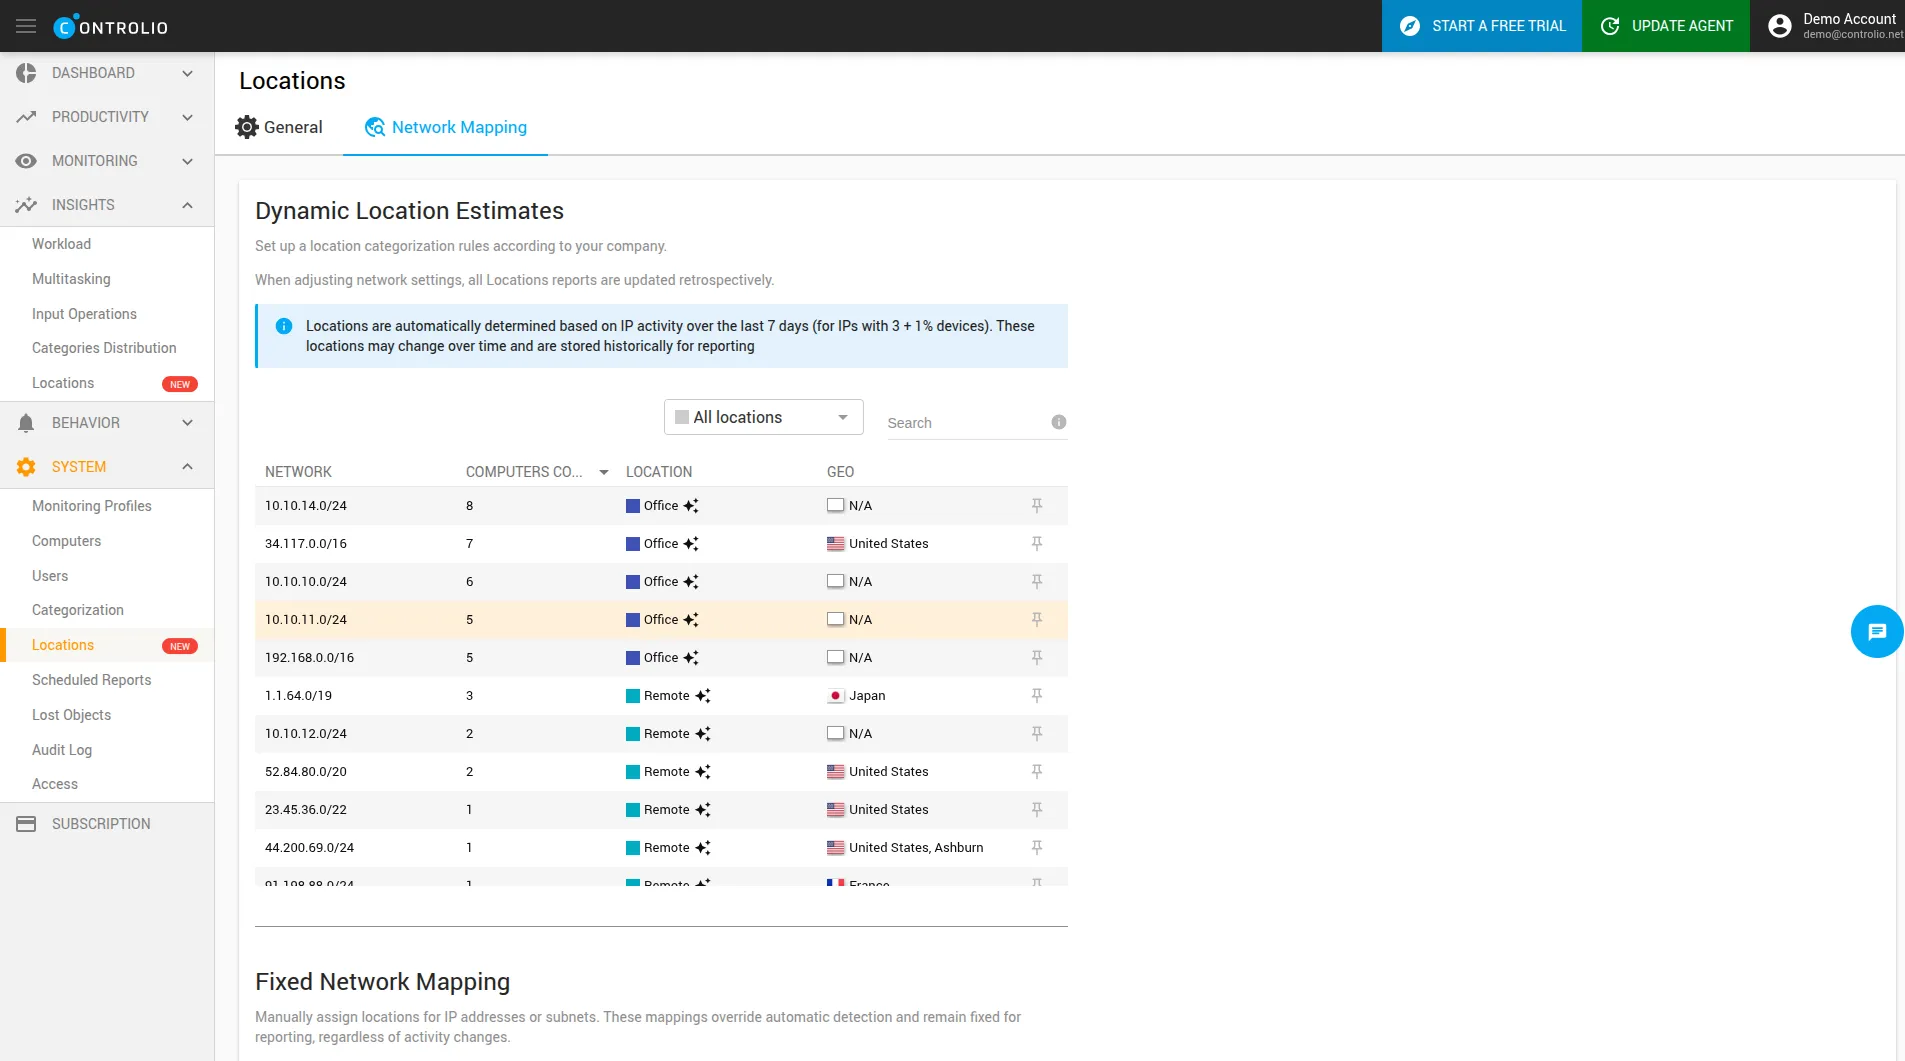
The Network Mapping tab shows the networks your computers connected from over the last week, with each network's subnet, number of computers, automatically estimated location type, and geo label. If an estimate is wrong — say, a small office that never reaches the detection threshold — click the pin icon to move the network to Fixed Network Mapping, or add the subnet yourself.
Fixed Network Mapping is the manual override: enter an IP address or subnet, choose Office or Remote, and that mapping stays fixed regardless of activity changes, always taking priority over automatic estimates. Note that manually added networks don't receive geo labels. When you adjust network settings, all Locations reports are updated retrospectively.
Tips
Give Locations a few days of data after installing agents — automatic estimation is based on the last 7 days of connections. If your company has several offices, each office subnet is detected as a separate Office network. If your team uses a VPN that routes all traffic through one gateway, map your subnets manually in Fixed Network Mapping for the most accurate picture.