Workforce Productivity
Analytics
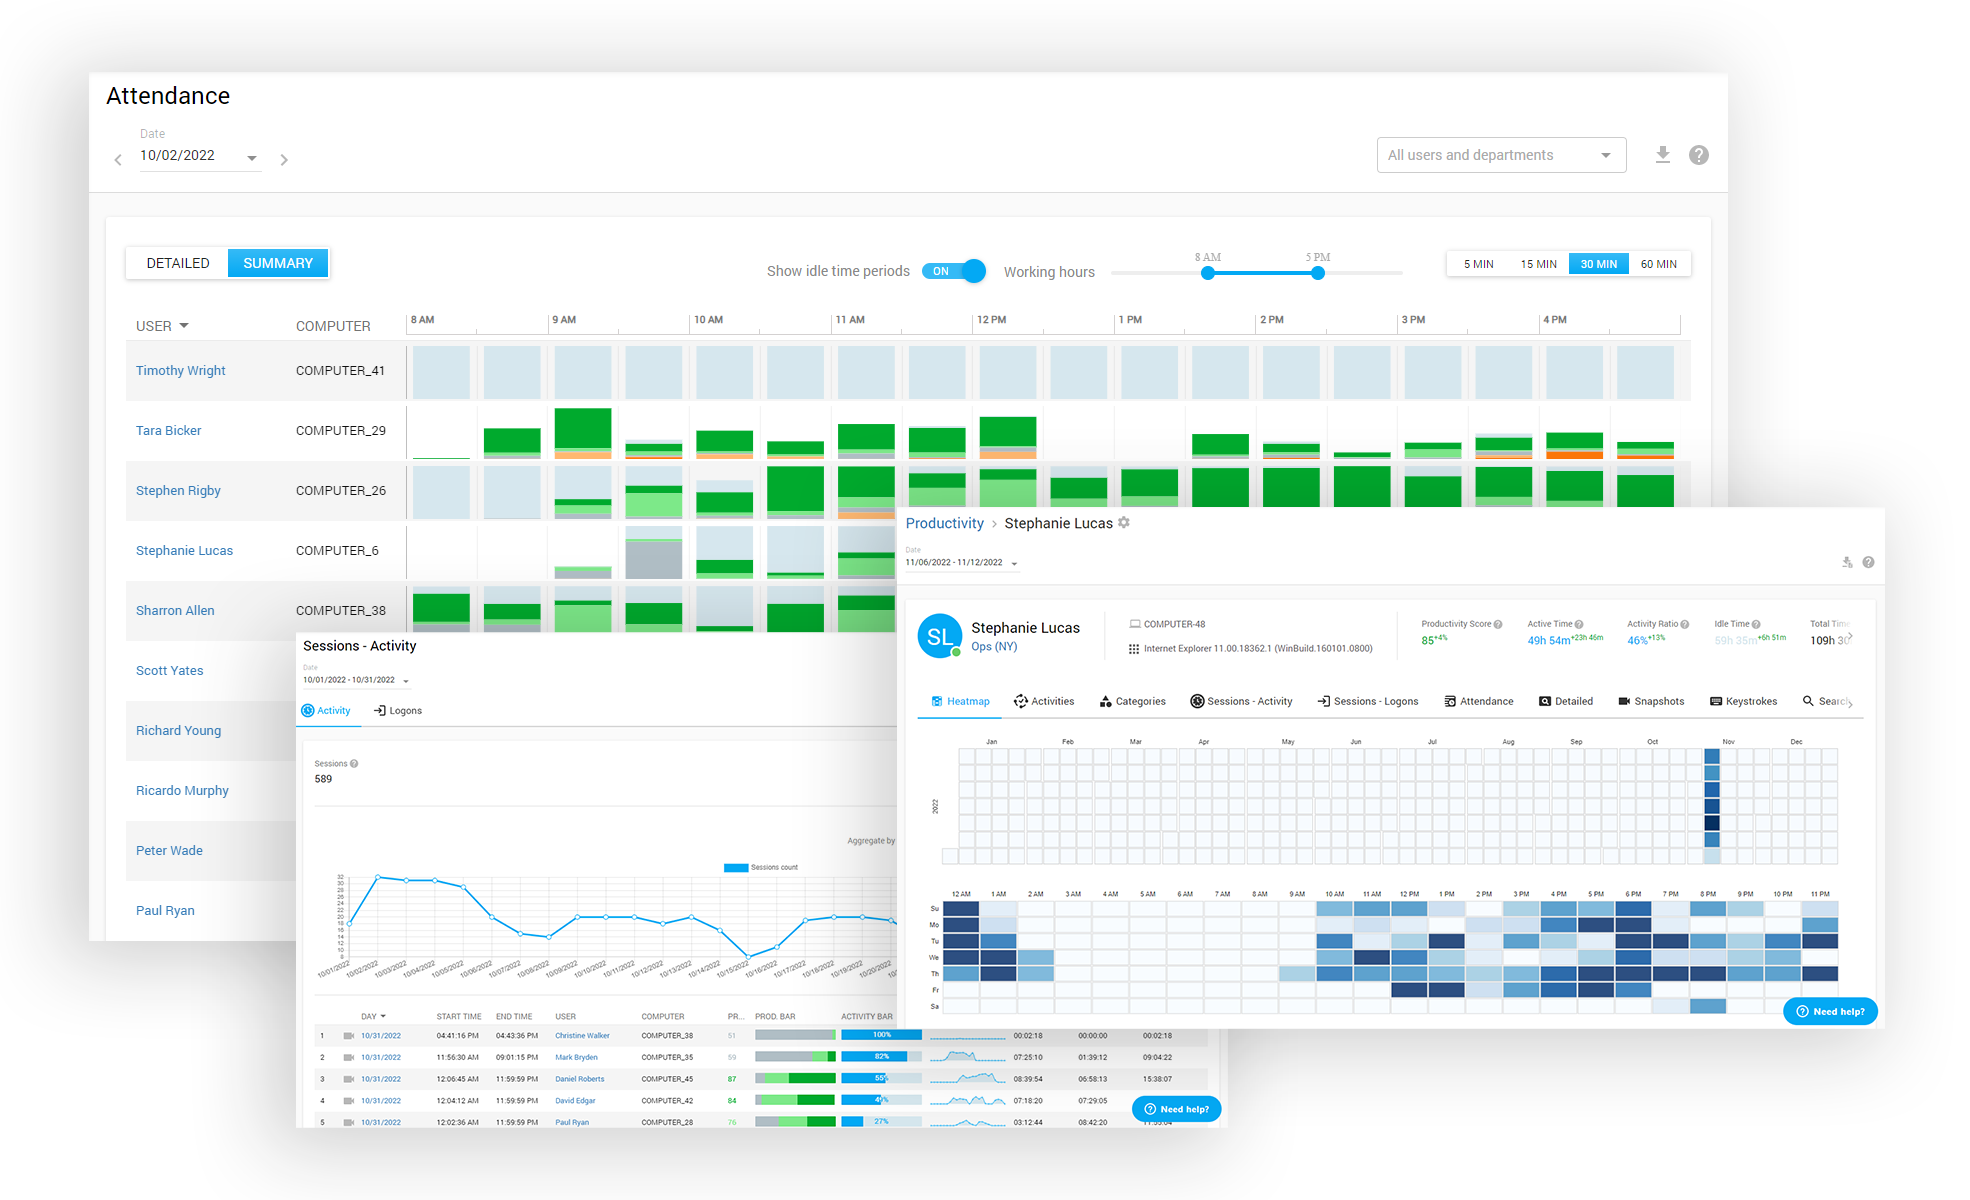
Get clear-cut figures and intuitive visualizations to learn how productive your staff is on both micro and macro levels. Spot productivity gaps on the fly and remove distractions or prevent damaging user behavior with a couple of clicks.

Healthy Work Habits
Assess workloads, encourage regular breaks, adopt flexible work schedules, and prevent burnout with Controlio’s insights into work patterns.
Smart Engine and Vast Database
Controlio comes with the opportunity to automatically categorize websites and applications according to their subjects and assign 5 productivity levels.
Agent Workload Forecasting
Controlio provides tons of historical data to predict spikes and dips in workloads and better respond to customer demand.
How Controlio Helps You
Understand and Improve Workplace Productivity
Adopt a data-centric approach to your workforce productivity and build an ongoing, comprehensive, and effective performance-boosting policy for your business to thrive.
Get an immediate insight into current workflows
 Monitor online sessions with a widget showing the activity state of all your connected workers in real-time.
- See immediately who is online and which of your staffers are currently away to match these data with established working hours
- Check what the workers are actually doing through the Activity window or get even a deeper view by watching a live-streaming video of their computer screens.
- Assess each person’s efforts taken for the last 60 minutes based on an easy-to-capture histogram.


Label websites and apps as productive or distractive
- Use highly flexible opportunities to categorize websites and apps based on their relevance to your working processes. You have five categories to ensure the most accurate labeling for further productivity tracking.
- Avail of fast access to productivity levels editing when you need to adjust the rules to the slightest changes in your work-related tasks.
- Apply even more detailed labeling by assigning custom productivity levels to different users and departments depending on the specifics of their work.
Measure and compare productivity across employees and departments
- Analyze your workforce productivity based on a clear KPI automatically calculated by Controlio. It generates productivity scores for your whole staff, separate teams, and individuals by measuring their use of applications and websites.
- Derive max benefits from the well-designed formula, which packs hours and activities into an easily understandable metric shown as a percentage and ranging from 0% to 100%.
- View the productivity score for any time span and compare the figure with the previous periods to grasp the dynamics.


Gain better visibility into labor hours utilization
- Transform each user interaction with a mouse or keyboard into meaningful statistics with Controlio recording the total time spent by your employees with their computers turned on and automatically calculating their activity ratio.
- Learn how much time your staffers spend doing something on their computers and how many hours go elsewhere every day, week, month, or year.
- Compare the numbers across users and teams to identify weak links or check the dynamics throughout a certain period to evaluate the efficiency of your managerial decisions.
- Explore the activity ratio per session and learn which of your team members stay idle in front of a computer screen most part of the time.
Construct a full picture of the websites and apps usage
- Find out how your workers use the Internet access and software solutions provided at the workplace to distinguish helpful tools from useless or even hurting and remove productivity killers.
- Observe your workforce’s active time distribution between applications and websites as well as between different categories of tools.
- Drill down into categories and activities through the corresponding reports where you can easily compare website and application usage by the time spent on them and their contribution to the overall performance.
- Rely on Controlio’s smart engine, which can recognize apps and websites using its vast database, arrange them into categories and assign proper productivity levels with no involvement from your side.


Reveal productivity gaps and trends with user-friendly visuals at hand
- Detect changes in productivity trends at a glance with the Periods widget, which clearly illustrates how your employees’ productivity fluctuates within a certain time.
- Get a deeper understanding of the trends with an interactive histogram that displays the users’ engagement in computer-based activities per hour, day, week, and month.
- Spot highs and lows during a single working day for each member of your team by analyzing graphs presented in the Timeline section.
- Track actual hours devoted to work by your staffers and see who is slacking, overworking, or late for work by exploring data collected in a user productivity digest.
- Adjust work schedules to the revealed activity patterns to boost your employee productivity while creating a more comfortable working environment for each worker.
Promote higher performance by establishing role models and uncovering rogue employees
- Let the Productivity widget serve as your leaderboard showing a list of the most productive workers by default. You can also use its sorting feature to see into employees with the poorest results.
- Examine the list of top violators and dig into correlations between failures to comply with your workplace policies and productivity drops.
- Evaluate the level of the staffers’ engagement in work activities based on visualized data attached to each user and find productivity patterns to introduce improvements across the whole staff.
- Sort workers by active time in a table located in the Productivity tab and get another leaderboard to rely on for making informed HR decisions.

How to Transform Controlio’s
Workforce Analytics into Effective Actions
Controlio’s smart solutions for enhancing performance go beyond collecting data, drawing charts, and generating reports. This productivity tracking software comes with a set of features that allow fixing productivity issues right away. Transform the insights received through the valuable metrics into effective actions and incorporate these tools into your performance-boosting strategy.
- Identify distracting websites and applications based on productivity analytics and block them completely by establishing the corresponding rule in the Behavior section.
- Grant limited access to social media websites, online marketplaces, news outlets, instant messengers, and other platforms that can be both destructive and helpful by specifying allowed users and an applicable time.
- Launch notifications informing supervisors about employees using distracting websites and apps to take immediate measures and get the staffers back on track ASAP.
- Redirect users from suspicious web-resource to work-related pages automatically.
- Customize the screen recording feature to probable non-work activities covering websites, apps, online searches, emails, and files to confirm or deflect the suspicions remotely.
- Prevent productivity declines due to workplace burnout and overwork by promoting regular breaks and a healthy work schedule with alerts linked to your workers’ non-stop active time.
- Stay informed about your employees’ idle time to immediately investigate the causes upon receiving notifications launched when the users fail to interact with their computers for a specified time.
- Factor in Controlio’s performance metrics when making decisions on promotions, salary raises, bonus pays, and other HR issues.

What Are Controlio Features?


Departments hierarchy
Live sessions monitoring
Remote client agent deployment
Multi-login Dashboard with access control list
Data Export to PDF, CSV
Agent Stealth mode and Icon mode
Audit Log (tracks activities inside the Dashboard)
2-Step Authentication
Cloud-based, on-premises, private AWS cloud deployment options
GDPR data recording&view mode
API for data integration
Active Directory OUs and users synchronization
Reviews
What our customers are saying
“EXACTLY WHAT WE NEEDED FOR A GROWING REAL ESTATE BROKERAGE”

"The biggest benefit has been understanding where operational bottlenecks occur before clients begin noticing delays. That visibility has improved transaction turnaround times and helped managers distribute work much more fairly across the office."
July 03, 2026
Co-Founder, Apparel & Fashion, 51-1000 employeesUsed the software for: 6-12 months
“DETAILED WORKFORCE ANALYTICS THAT GO BEYOND BASIC TIME TRACKING”
"The time distribution analytics provide much deeper visibility than traditional tracking tools. Instead of simply seeing hours worked, we can understand how time is distributed across various activities and workflows. This has helped us identify operational inefficiencies and improve resource allocation."
June 22, 2026
VP R and D, Information Technology and Services, 11-50 employeesUsed the software for: 1-6 months
“AUTOMATED REPORTING THAT KEEPS OUR CONTACT CENTER ORGANIZED”
"The biggest improvement has been reducing administrative work for supervisors. Instead of manually tracking performance throughout the day, we can focus more on supporting agents and improving customer service quality."
July 06, 2026
CEO and Founder, Financial Services, 51-1000 employeesUsed the software for: 1-6 months