Dashboard
Controlio was initially designed to help boost employee productivity, and provide managers with the ability to coach employees efficiently. This is why we have designed a user-friendly Dashboard with a summary of precisely what you need to know about your team’s daily work activities.
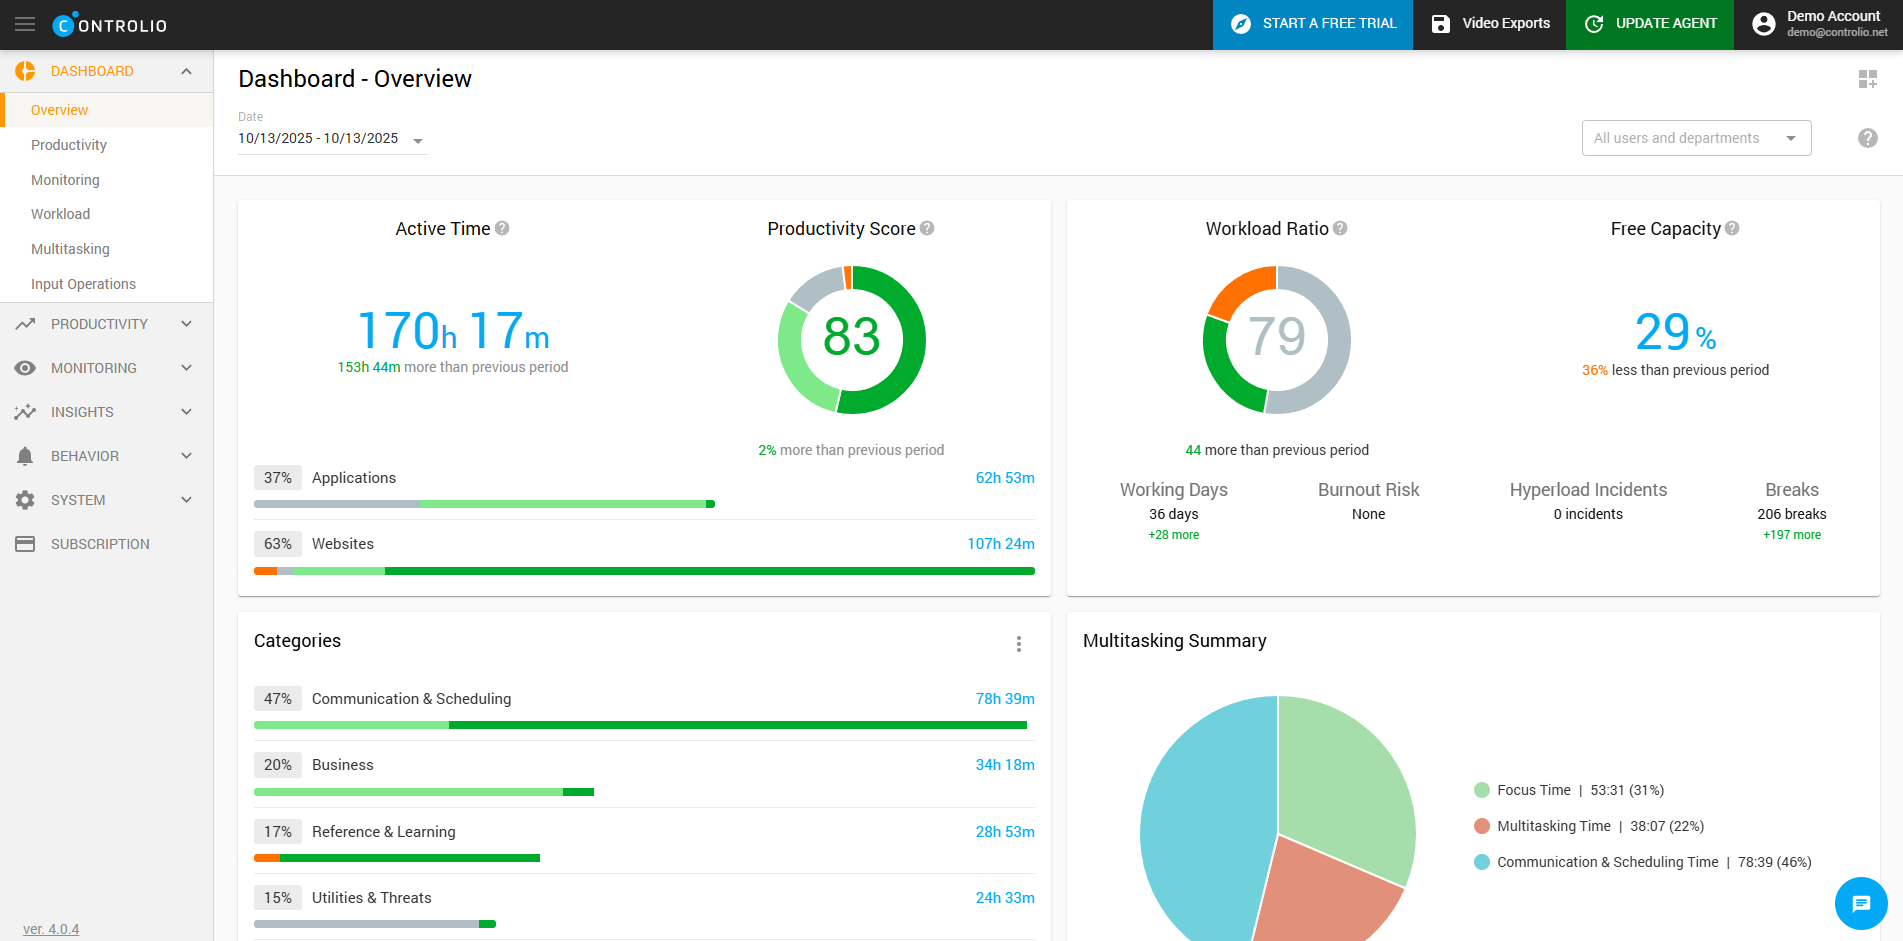
On the Dashboard, you will find the most critical details of your team’s performance presented in a high-level summary that provides meaningful insight into overall employee activity and productivity. The left side of the screen displays a concise productivity overview, highlighting key trends and performance indicators. On the right side, the Dashboard offers deeper visibility into workload distribution and multitasking behavior. These sections help you understand how responsibilities are allocated across team members, identify potential capacity constraints, and observe how frequently employees are switching between tasks or handling multiple assignments simultaneously. Together, these insights give you a clearer picture of operational balance, focus levels, and areas where support or optimization may be needed.

Avail of the various summaries to get a hint of any anomaly and keep your fingers on the pulse of your company. Some widgets may allow you to sort data by unique parameters with a context menu.

Active Time VS Productivity Score
The Dashboard provides you with an overview of employee productivity over any period of time. The summary widget reflects the total amount of Active working hours of employees, while the Productivity Score gives you an understanding of which types of activities this time was spent on depending on productivity levels that are assigned to each activity the employee engaged in within this duration.
The Active Time of each employee is measured from the moment they make their first keystroke or mouse interaction, on the other hand, time starts counting as Idle when there is no keyboard or mouse interactions for 60 seconds by default; This value may be adjusted to match your business’s work policy.

The Productivity Score is based on which applications and websites employees engage in. It shows how productive employees were depending on pre-assigned productivity levels - very productive, productive, neutral, distracting, or very distracting. The Productivity Score is shown as a percentage ranging from 0% to 100% for the entire active time duration.
Controlio even compares the Active Time and Productivity Score of the current selected work period to those from the previous work period. This comparison provides you with an objective way to determine how the productivity of your team is changing from one work period to the next. (Day to day, week to week. etc.).
The various Dashboard widgets provide you with a color-coded overview of your employees' productivity ranging from red to green.
Categories widget
Controlio monitoring is comprehensive enough to give you an overview of particular categories of activities, such as business; communication and scheduling; social networking, and more. There are dozens of specific categories in Controlio, when you click on the widget, you’ll access the full Categories report.

Online sessions
The Online Sessions widget shows real-time information about your employees’ current sessions. You can see the name of the monitored user, activity status (green for active, yellow for idle), PC name, application or website that is being engaged, and the title of the window that is showing on his foreground. There is even a Last Activity visual that shows you a minute-by-minute breakdown of employees’ activity pulse in the previous 60 minutes.

You can take real-time monitoring one step further. If you click the screen icon to the left of any user’s name, you can watch a live video of what is happening on that particular user’s screen at that precise moment. A video player will appear in a popup window on your screen to show you exactly what your employee is viewing.

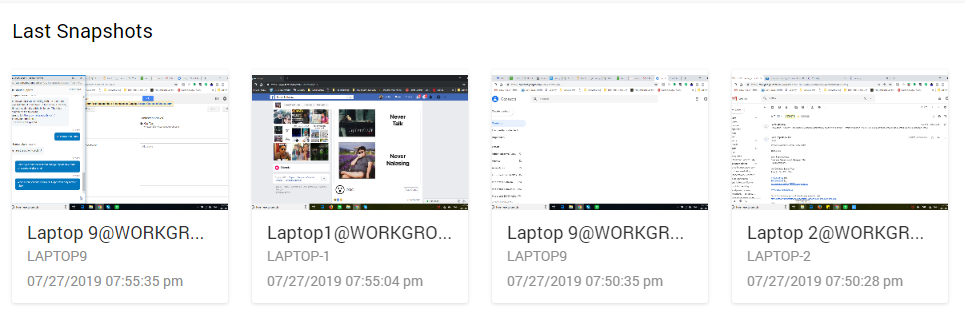
Screen snapshots
The Last Snapshots widget enables you to view screenshots of what your employees were working on most recently. Snapshots are taken every 5 minutes during an employee’s active time. Snapshots are timestamped, so clicking on one of them will redirect you to the part of the day’s screen recording when they were taken.
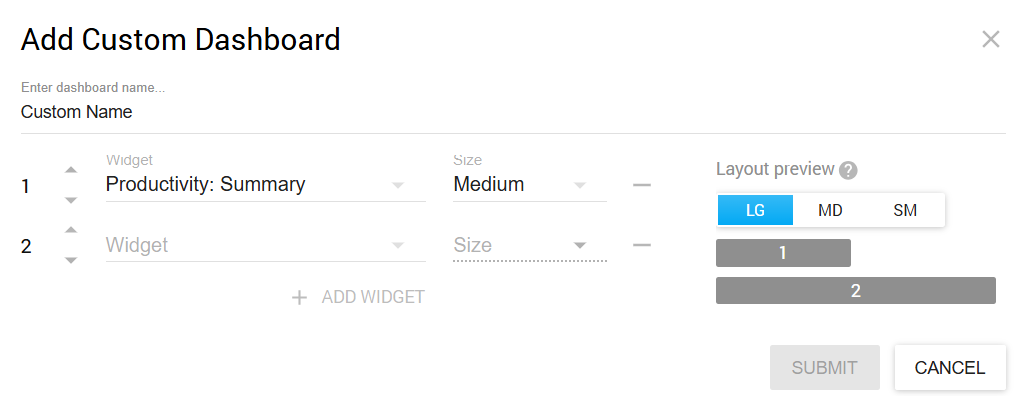
Custom Dashboards
With the help of this feature, you can hand pick all the widgets that are relevant to your use case, and create a new Dashboard with a custom name to simply your daily management patterns.
Everything you need in one secure Dashboard
The Controlio Dashboard offers several other widgets, including periods, alerts, users, app usage, and more. They are conveniently located so that you can access information as efficiently as possible. Every widget is linked to a full report or an extended view. All you need to do is to click on the header of the widget to access this level of detail.

Receiving all types of information about your team’s productivity & efficiency provides you with a better opportunity to control and distribute the time of employees more effectively.