Categories
On this page you will have high-level report of activities, grouped into categories. You can quickly see how your employees spend their time. It’s visualized with charts, so it’s easy to compare Business and Social Networking time spent.

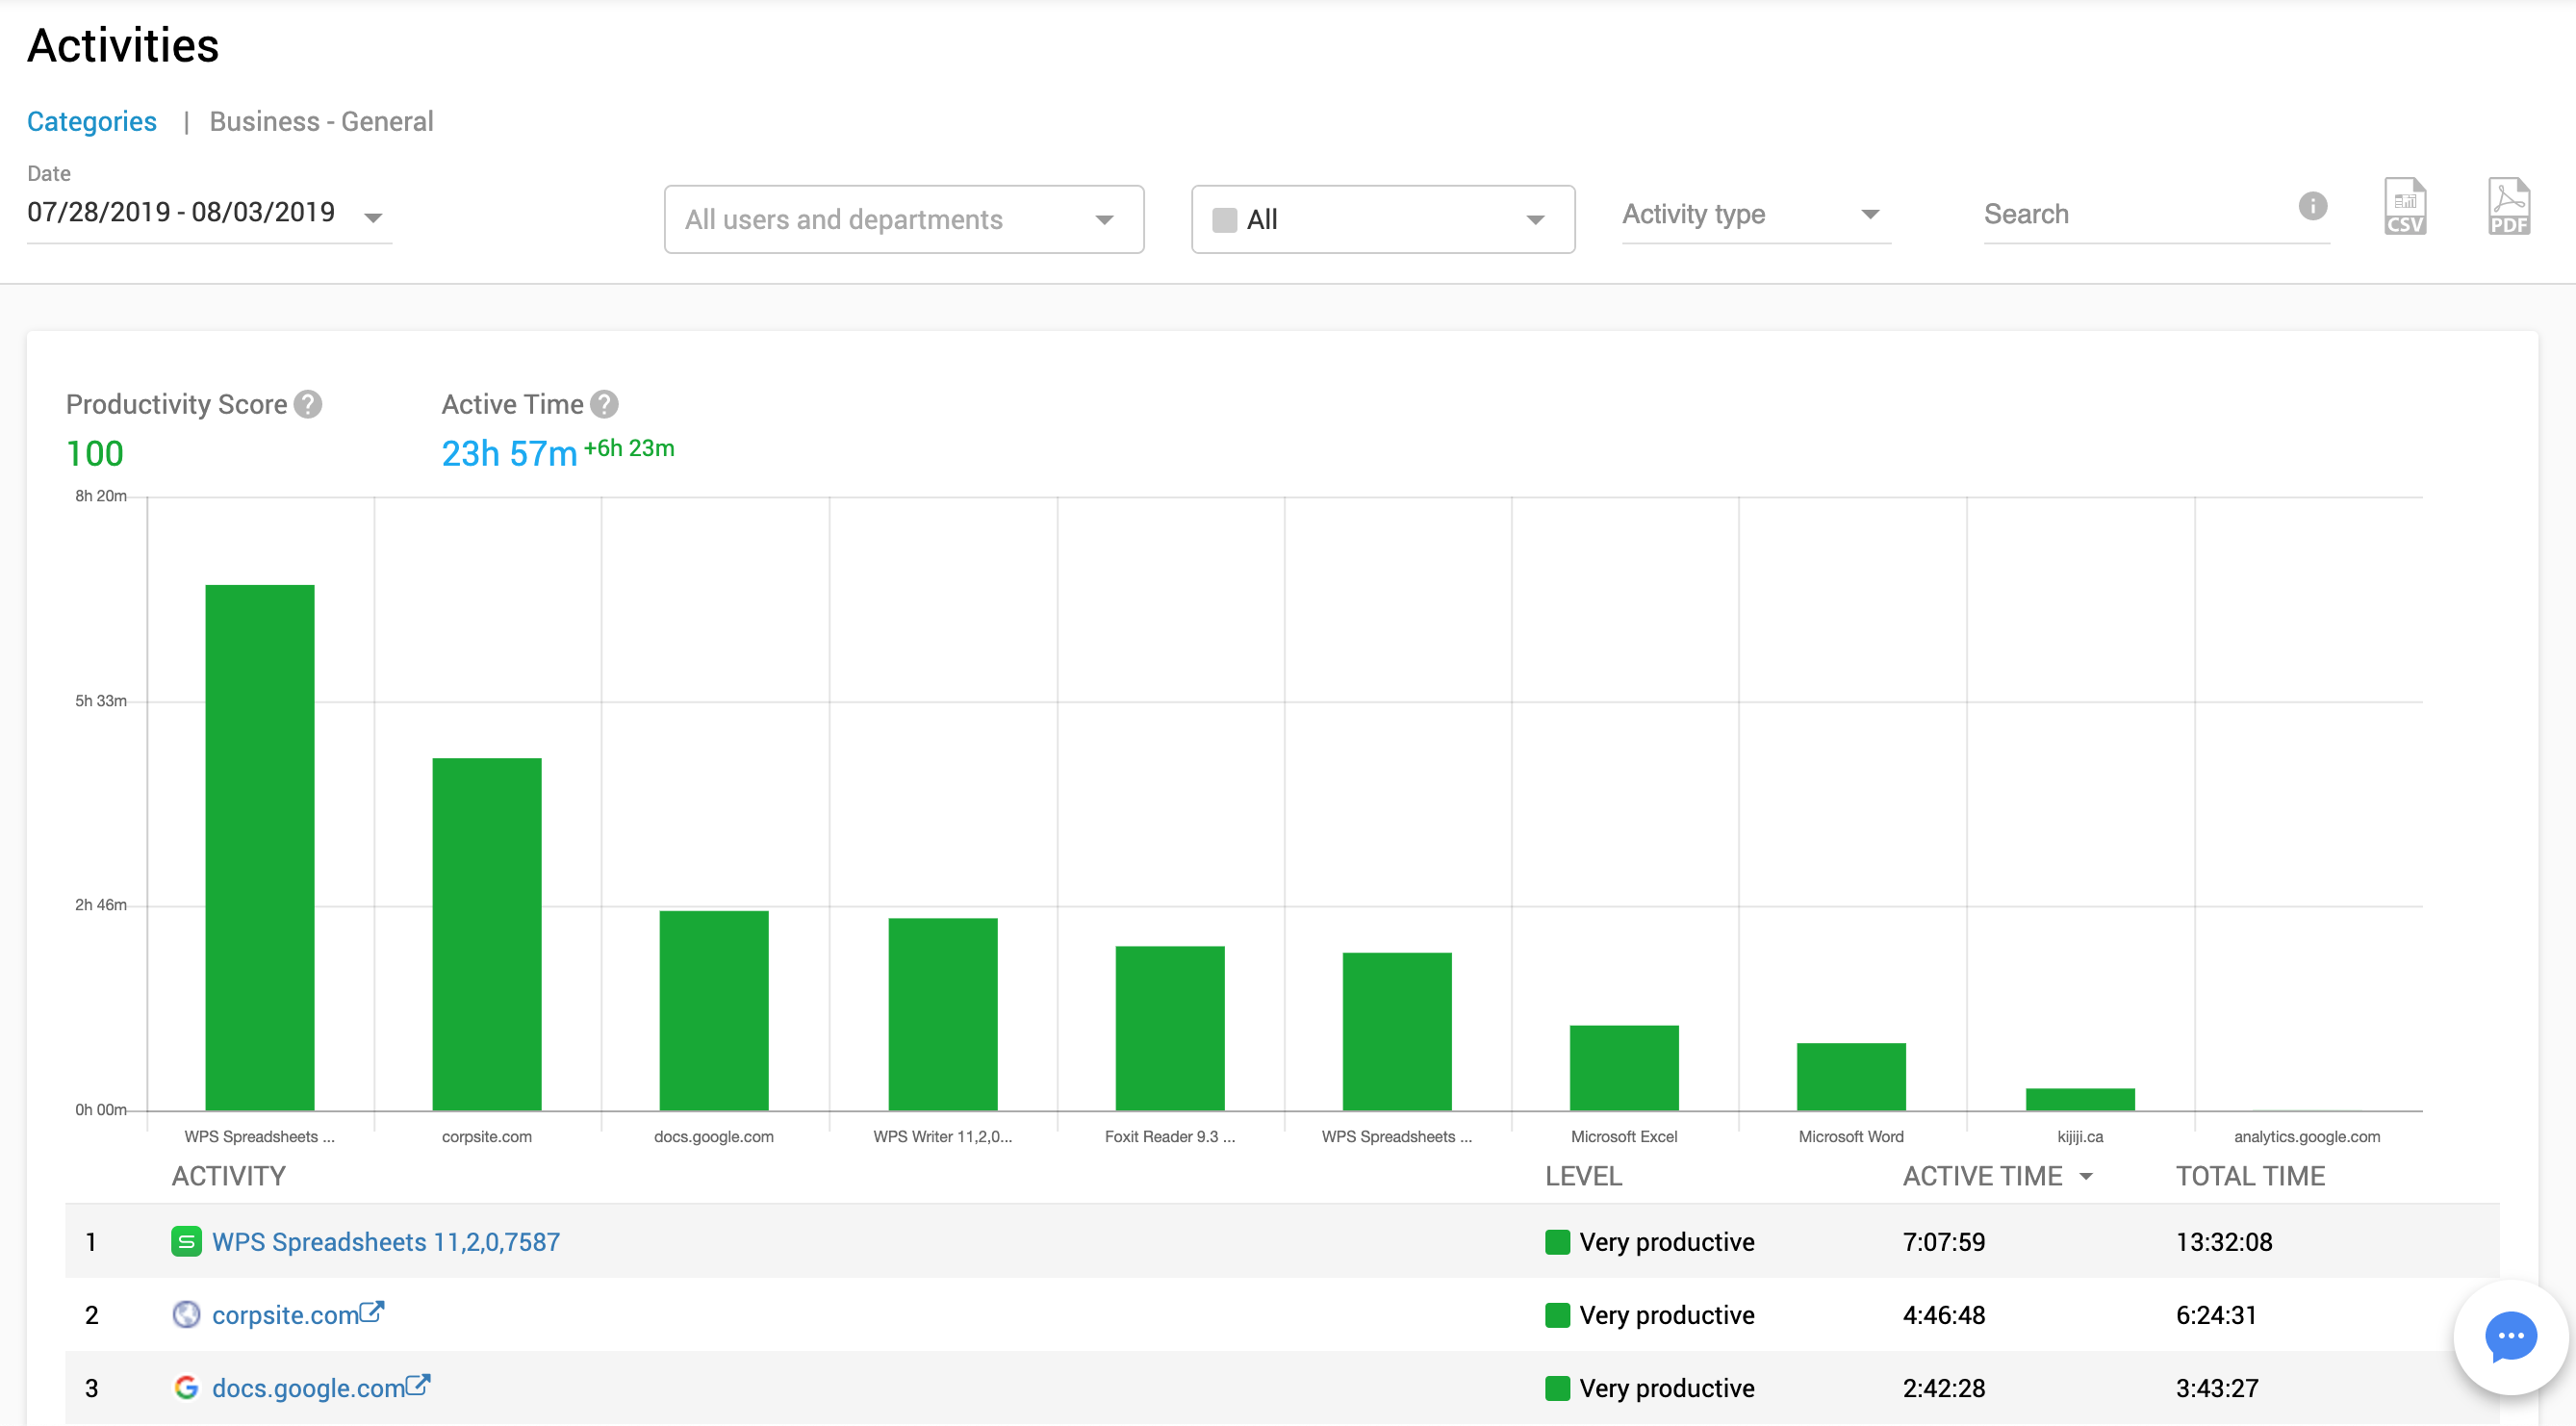
On the top of the report you may see:
Productivity
Score – calculated dynamically for the selected report data and filtering criterias
Active Time – computer working time while mouse/keyboard actions took place (active time counter stops if user session is idle for 30 seconds and more)

By default, Controlio uses preset categories but you can add your own in the Activities report.
If you click on some category, you will be redirected to the Activities report for this category.
Note: if you see a lot of time (Uncategorized) that was not categorized automatically by Controlio’s engine– please do it manually for your most popular apps and websites from the Activities report. So, your report data will look more accurate and clear.