Productivity
Productivity Score
The Productivity Score measures your team’s level of productivity. Levels of productivity are calculated as percentages and range from 0% to 100% productivity.

This indicator is calculated by monitoring and measuring your team’s active use of computer programs and websites. The calculation is measured in units of time, which are then categorized in parameters (‘productivity levels’) that show your team’s time as either very productive (vp, weight 4), productive (p, weight 3), neutral (n, weight 2), distracting (d, weight 1), or very distracting (vd, weight 0).
Productivity Score formula:
25 x ( d + n x 2 + p x 3 + vp x 4 ) / ( vd + d + n + p + vp )
The maximum Productivity Score value is 100, the minimum value is 0. It can be calculated to any set of apps&sites, users&departments.
Note: you may set up custom productivity level settings for applications/websites per users or per departments.
Another way to measure employee productivity is by using the Productive Time metric (Prod. Time).
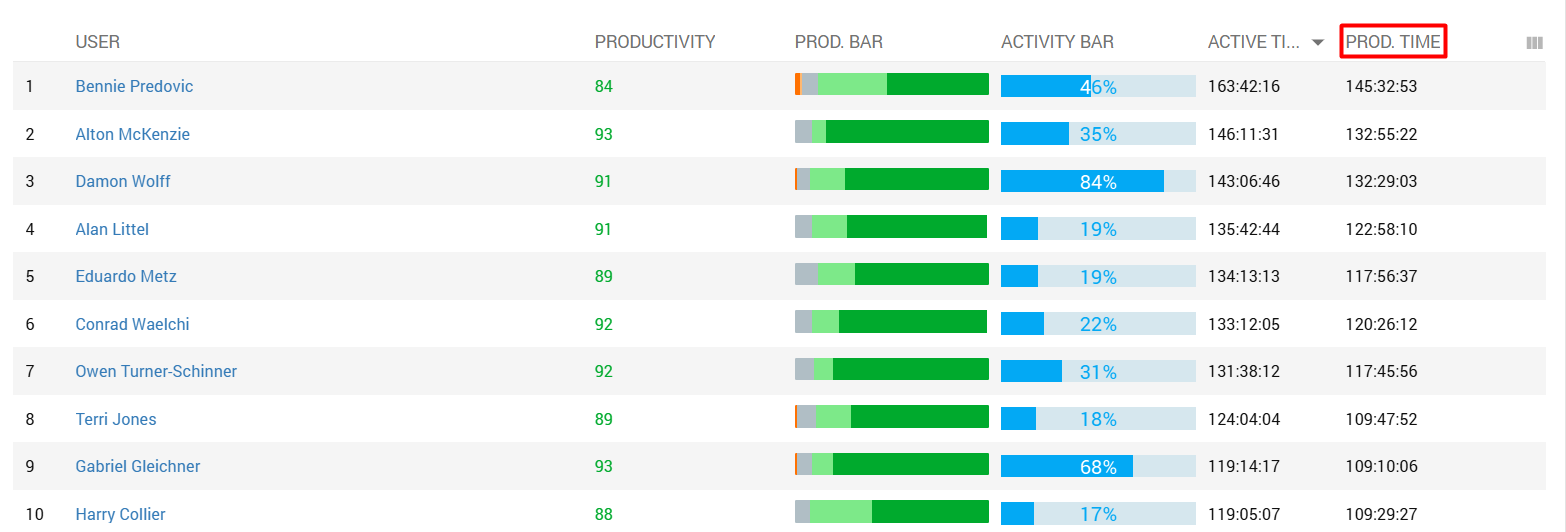
Productive Time - Takes into account only time spent on activities that are labeled as Productive or Very Productive by default.
You can configure productivity levels at the category level in System - Categories (the 1st level)

and overwrite them at the activity level in the Activities report (the 2nd level).
