Workforce Analytics 2.0: Predicting Employee Burnout Before It Happens
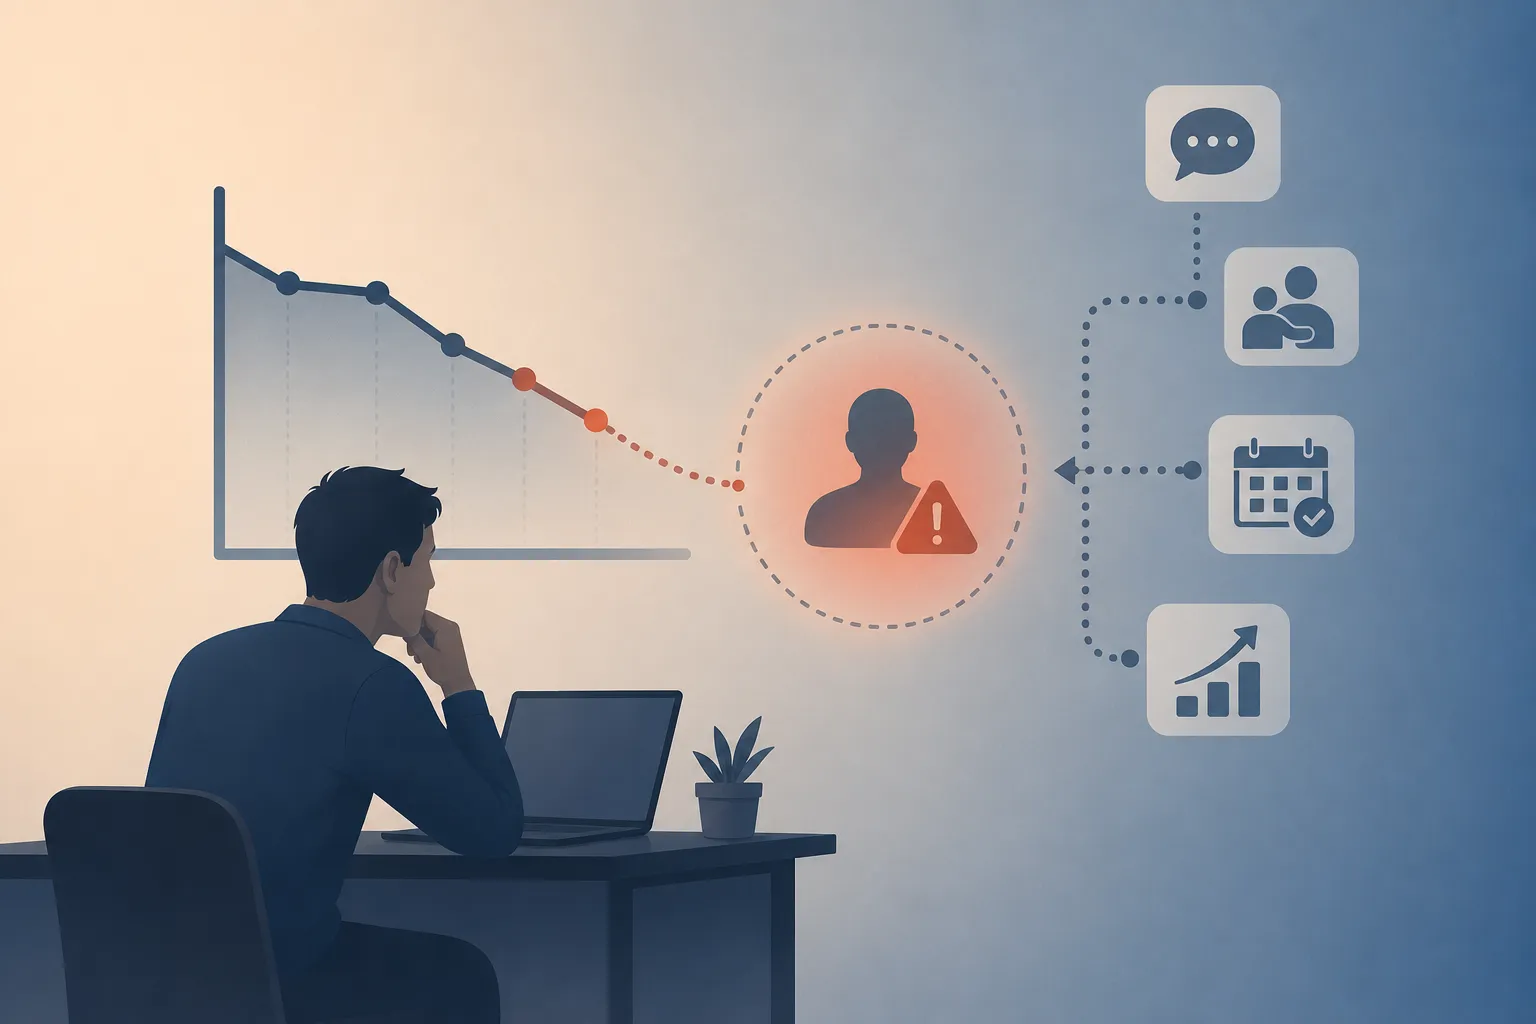
Employee burnout usually does not happen all at once. It builds slowly through long hours, constant meetings, late-night work, heavy context switching, missed breaks, and a steady decline in focus time. By the time burnout is obvious, the damage has often already been done. Recent studies show that 65% of the workforce in the US is currently experiencing some form of burnout.
An employee may start missing deadlines. Their work quality may drop. They may become less responsive, less engaged, or more frustrated than usual. Eventually, they may take extended time off or leave the company altogether. For managers, the problem is not always a lack of concern. It is a lack of visibility.
Traditional productivity management looks backward. It tells leaders what happened after performance has already declined. Controlio's Workforce Analytics 2.0 is different. It uses behavioral data to show early warning signs before burnout turns into a serious employee wellbeing or retention problem.
This is where Controlio can play an important role. Controlio’s Workforce Analytics 2.0 gives organizations an earlier, clearer view of employee burnout risk. Rather than simply reporting productivity after it declines, the platform helps leaders recognize patterns associated with unsustainable work. This includes excessive hours, meeting overload, reduced focus time, skipped breaks, and uneven workloads.
It turns everyday workforce data into actionable insight, helping managers address potential problems before they lead to disengagement, extended absences, or employee turnover. The goal is not to watch employees more closely for the sake of surveillance.
The goal is to understand when people are being pushed too hard, when workloads are uneven, and when productivity decline may be connected to digital exhaustion instead of poor performance.
Why Burnout Is Hard to Detect
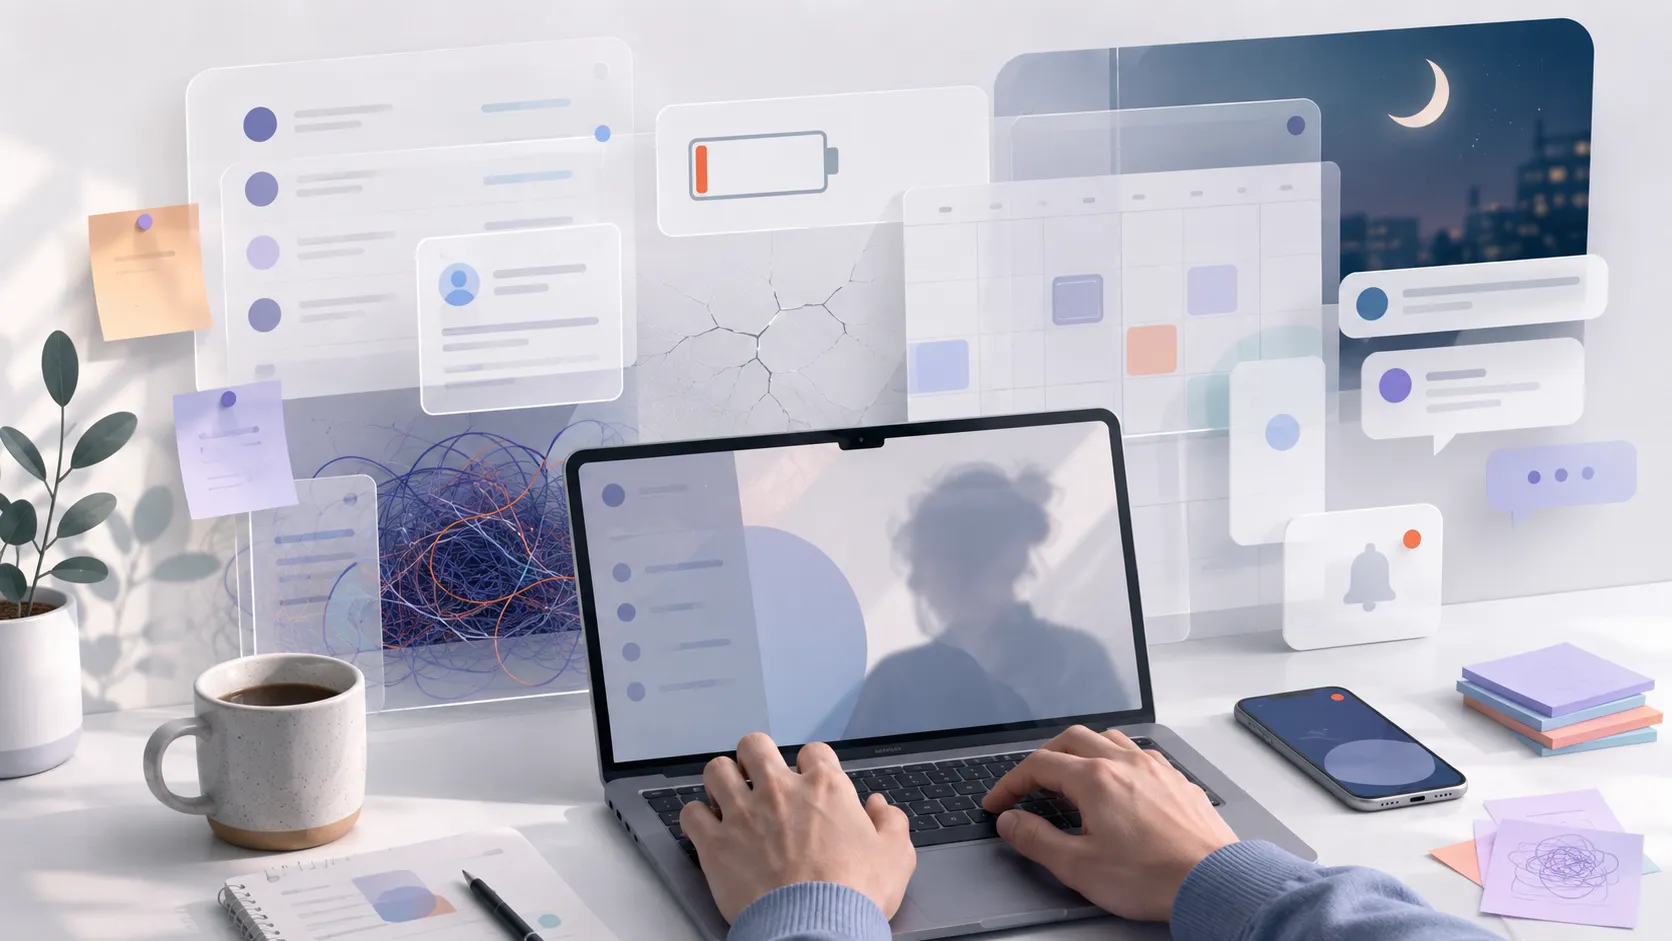
Burnout is often mistaken for a performance issue. An employee who used to be focused may start missing details. A high performer may slow down. Someone who normally communicates well may become quiet or short in messages. Without context, a manager may assume the employee is distracted, disengaged, or not working hard enough.
In many cases, the opposite is true. The employee may be working too much.
They may be answering messages after hours, spending large parts of the day in meetings, switching between too many tools, or trying to keep up with an unrealistic workload. The problem is not effort. The problem is that the work pattern is not sustainable.
This is why burnout analytics matter. Managers need more than a basic productivity score. They need to see the patterns behind the score. Are employees working late several days in a row? Are they taking breaks? Are they spending too much time in communication tools and not enough time on focused work? Are certain teams carrying more work than others?
What Is Workforce Analytics 2.0?
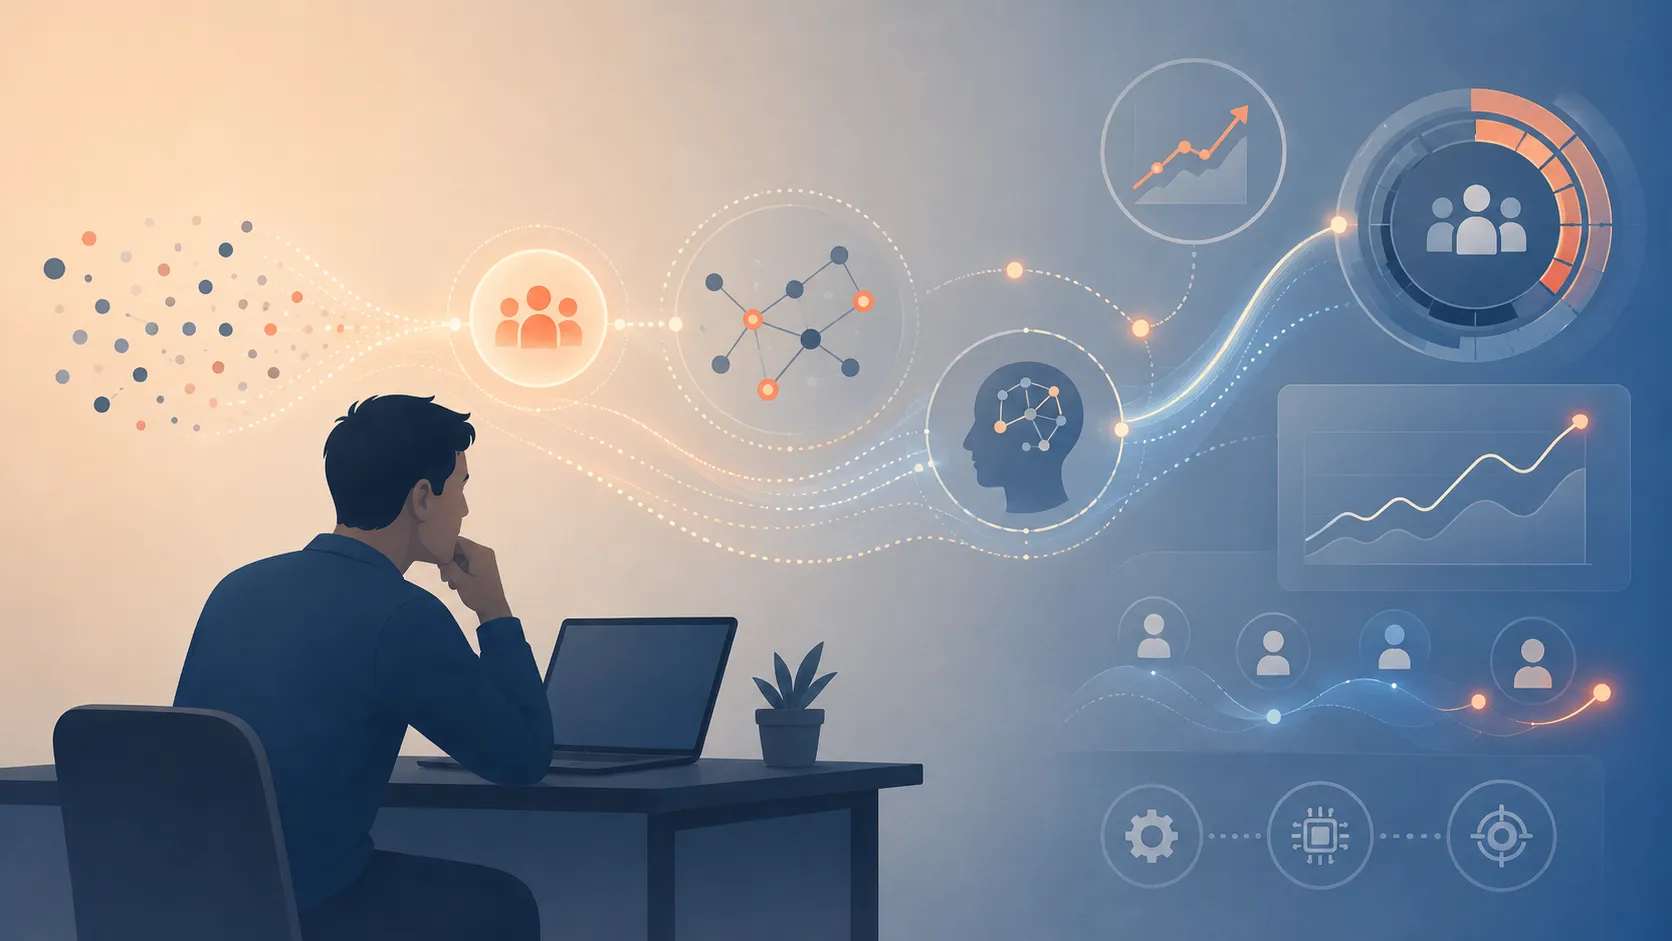
Workforce analytics used to be mostly about measuring output. Managers looked at hours worked, tasks completed, attendance, and maybe basic productivity data. That helped companies understand activity, but it did not always explain employee wellbeing.
Workforce Analytics 2.0 goes deeper. It looks at behavioral patterns that show how work is actually happening. This includes workload balance, active time, idle time, overtime, break patterns, application usage, website usage, focus time, multitasking, and productivity fluctuations.
This approach gives leaders a better picture of workforce health. Instead of only asking, “Are employees working?” managers can ask better questions:
- Are employees working too much?
- Are they getting enough uninterrupted time to focus?
- Are certain teams overloaded?
- Are employees switching between too many apps?
- Are after-hours work patterns becoming normal?
- Is productivity dropping after long stretches of high activity?
These questions matter because burnout is rarely caused by one bad day. It usually comes from repeated patterns. Workforce analytics helps managers identify those patterns before they become a larger problem.
The Main Burnout Indicators Hidden in Workforce Data
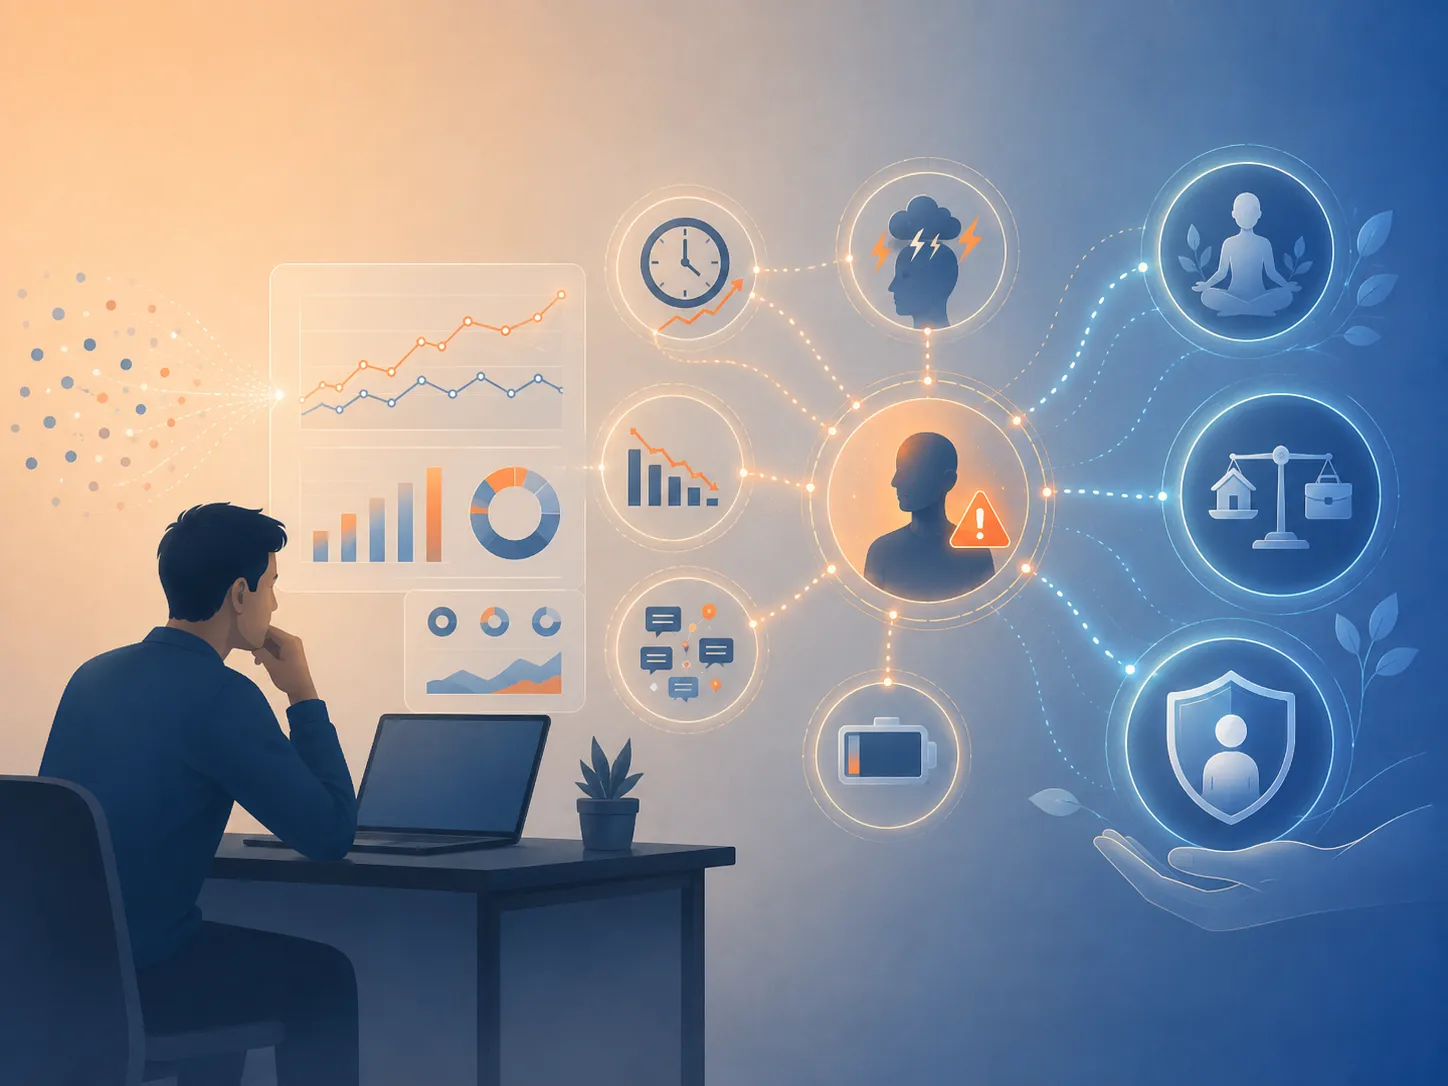
Burnout can show up in several ways. Some signs are emotional or personal, which software should not try to diagnose. But many signs are behavioral and work-related. Those are the signals workforce analytics can help identify.
A strong burnout analytics strategy looks at patterns such as overtime, excessive meetings, after-hours work, context switching, declining focus time, reduced productivity, and missed breaks.
None of these signals proves someone is burned out by itself. An employee may work late because of a deadline. A busy meeting week may be normal during a product launch. A drop in focus time may happen during onboarding, training, or cross-functional planning.
The value comes from seeing patterns over time. When several warning signs appear together, managers have a reason to check in, rebalance work, or adjust expectations before the employee reaches a breaking point.
Overtime Trends
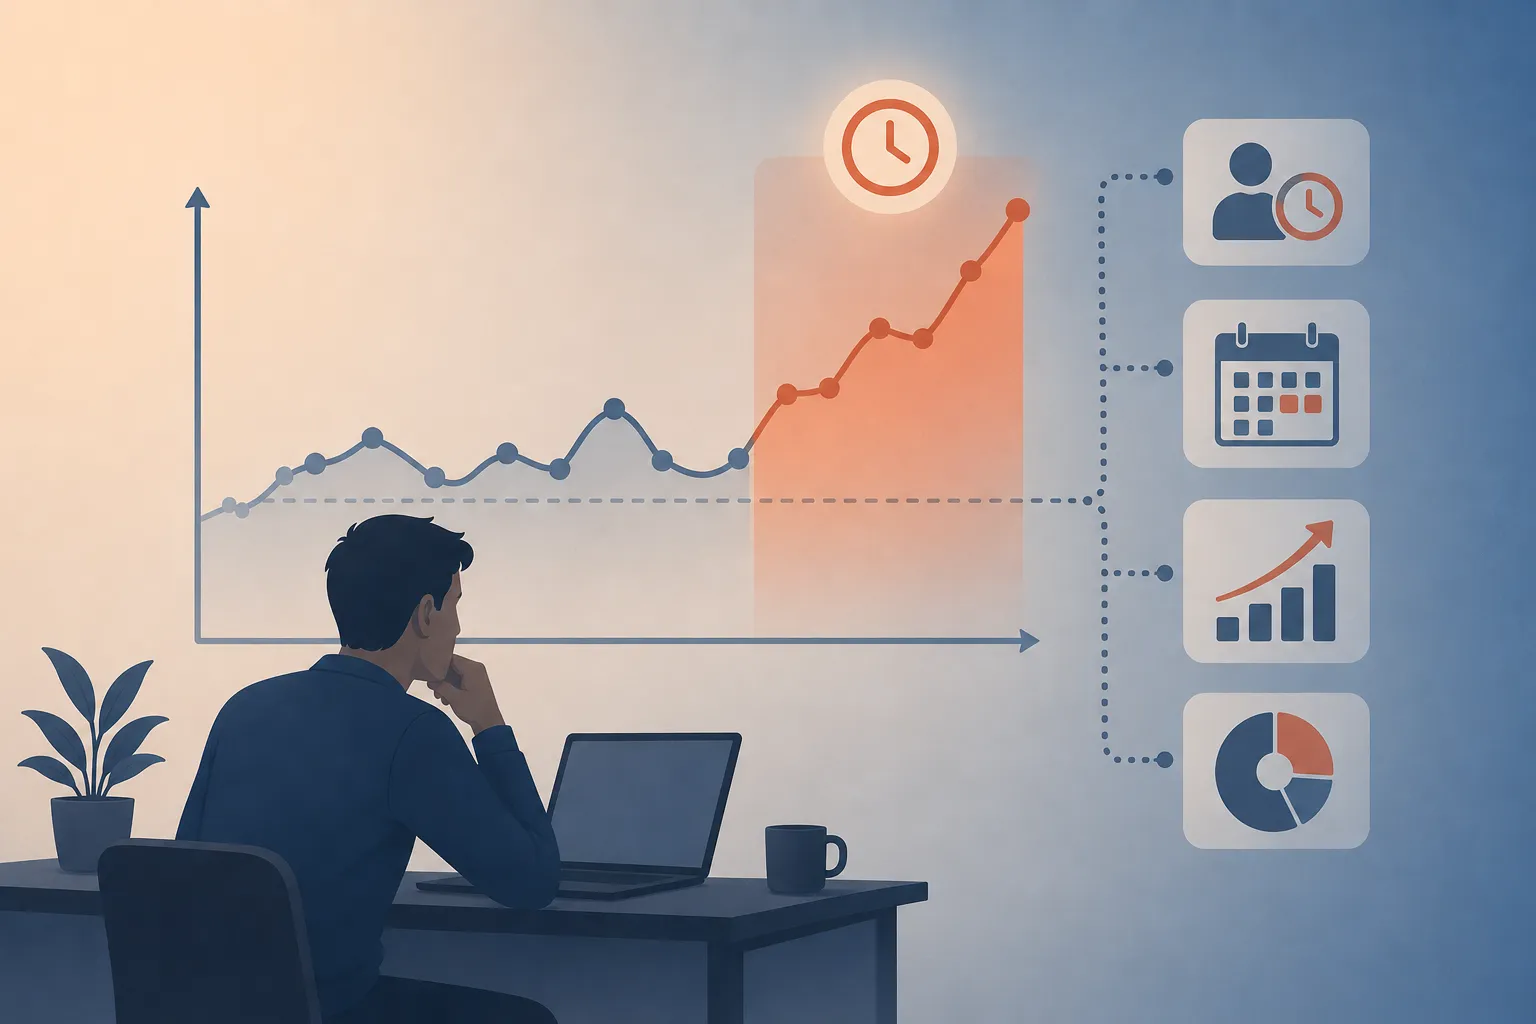
Overtime is one of the clearest burnout indicators. A few long days may not be a problem. But when an employee is overloaded for several days or weeks in a row, the risk changes.
The problem is not just the number of hours. It is the pattern. If an employee regularly works longer than expected, skips breaks, and stays active outside normal hours, the data may show an overwork problem before the employee says anything.
Controlio helps managers look at actual work time, active time, idle time, and workload distribution. With Controlio’s Workload Management insights and workload-related dashboard widgets, managers can see when employees are consistently overloaded or underloaded. This makes it easier to redistribute work before one person becomes the default solution for every urgent task.
This matters for retention. High performers are often the employees most likely to become overloaded because managers trust them to handle more. Without workload visibility, those employees can quietly absorb extra work until they burn out or leave.
Workforce analytics helps managers protect those employees by showing when “reliable” has started to become “overextended.”
Excessive Meetings
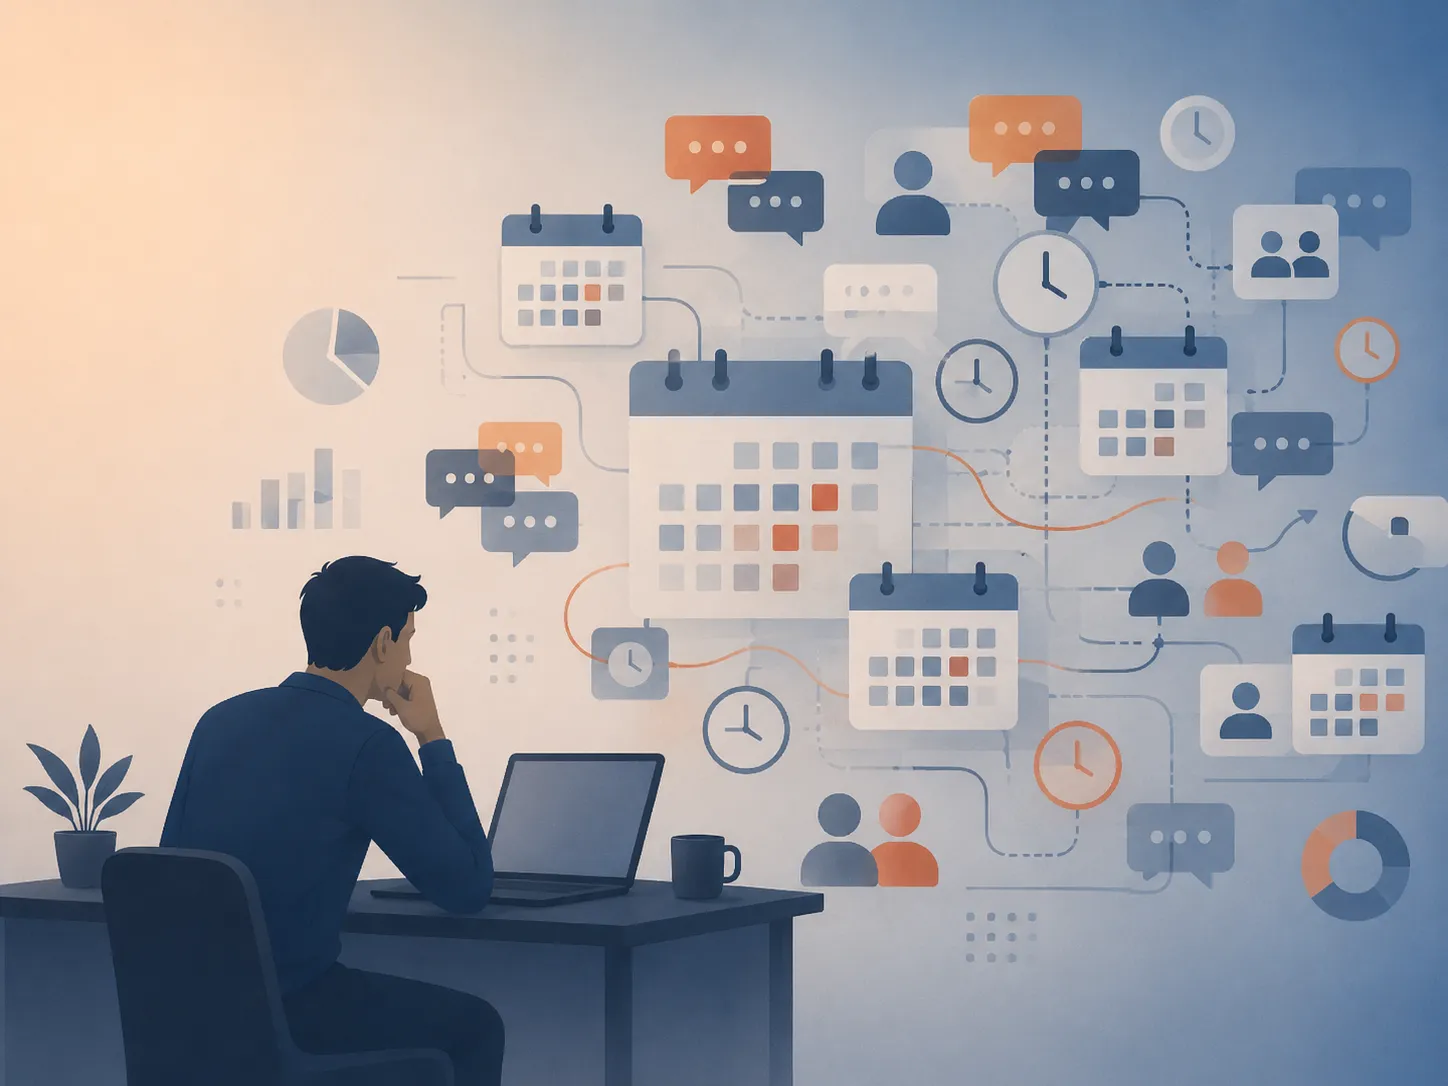
Meetings are another common source of digital exhaustion. They may not look like a problem in a task tracker because the employee is technically working. But too many meetings can leave little time for deep work.
When an employee spends most of the day in calls, chat tools, and collaboration apps, they may have to complete their actual work before or after normal hours. That creates a cycle where the calendar looks full, the work still has to get done, and the employee has no real recovery time.
Behavioral analytics can help managers identify this pattern. App and website usage data can show how much time employees spend in communication tools compared with focused production tools. Focus and multitasking insights can show whether the day is being broken into small, interrupted pieces.
The point is not to remove meetings completely. Meetings are necessary. But when meetings crowd out focus time, employees are forced to make up the difference somewhere else. That “somewhere else” is often early mornings, lunch breaks, evenings, or weekends.
Controlio gives managers a way to see whether employees have enough time to do the work they are being asked to discuss.
After-Hours Work
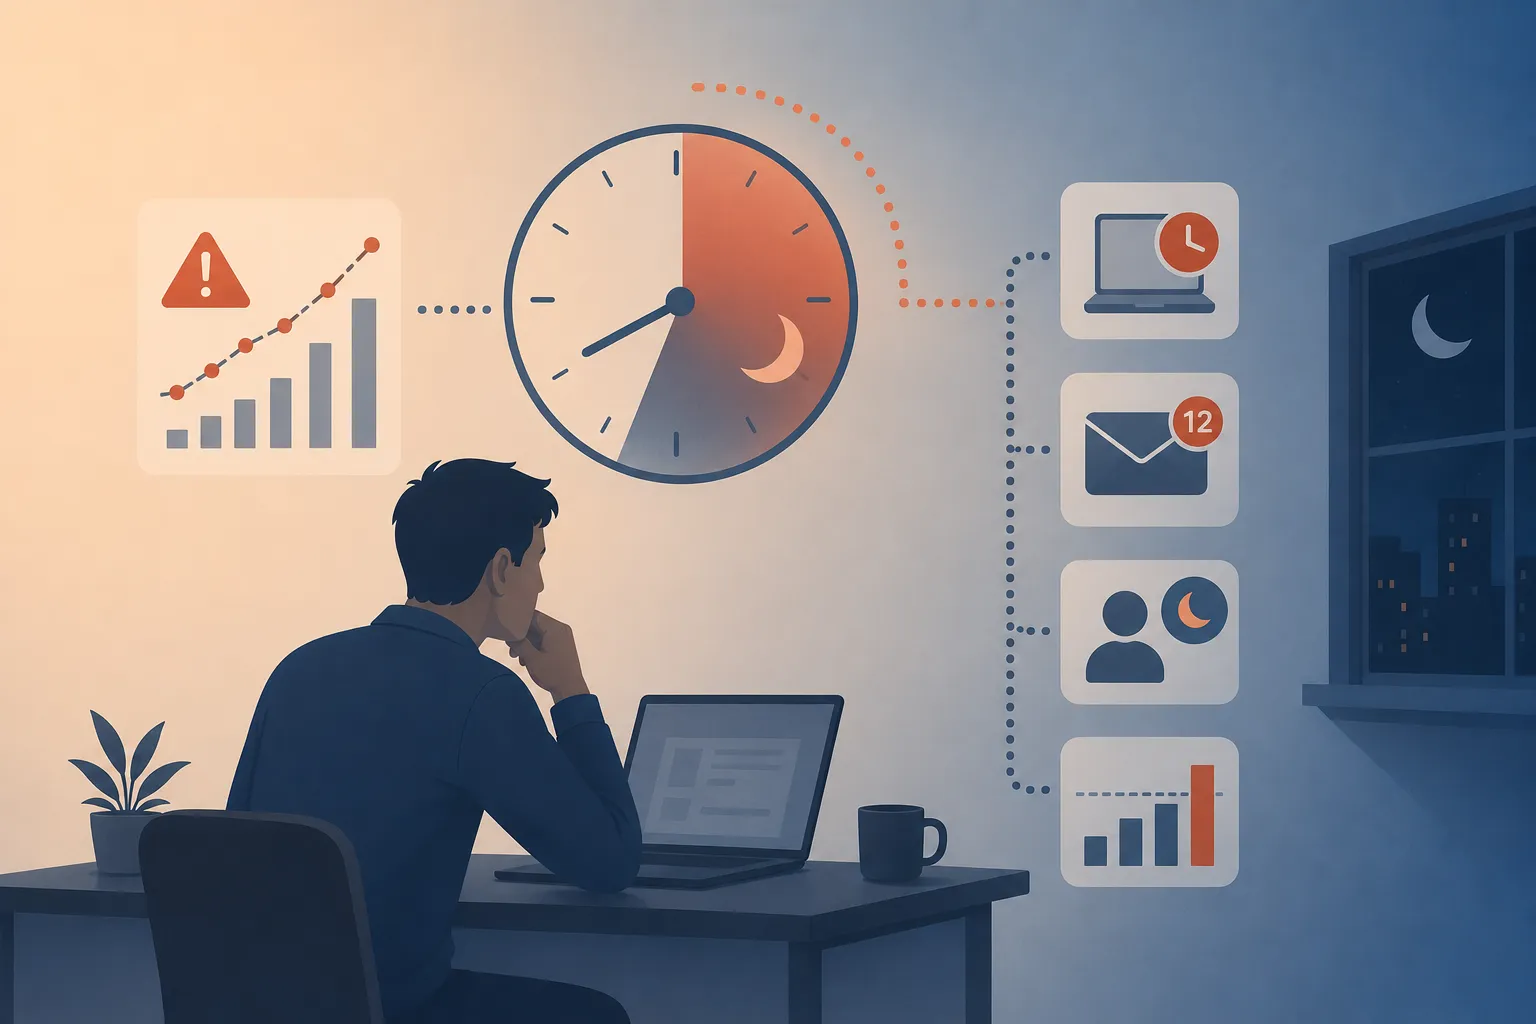
After-hours work is one of the easiest burnout signals to overlook. In remote and hybrid teams, it can feel normal for employees to answer messages at night or finish small tasks after dinner. Over time, that creates an always-on culture.
The issue is not one late email. The issue is repeated after-hours activity that becomes part of the employee’s routine. If someone is regularly active outside normal working hours, managers should ask why. Common reasons include:
- Is the workload too heavy?
- Are meetings consuming the day?
- Is the employee supporting another time zone?
- Are deadlines unrealistic?
- Is the person struggling to disconnect?
Controlio’s work time logging and activity reports can help managers see when work extends beyond the expected schedule. This is especially useful for remote workforce analytics because managers cannot rely on office visibility to understand work habits.
When after-hours work becomes a trend, managers can intervene earlier. They can move deadlines, adjust meeting loads, add support, or clarify that employees are not expected to stay online after the workday ends.
Context Switching
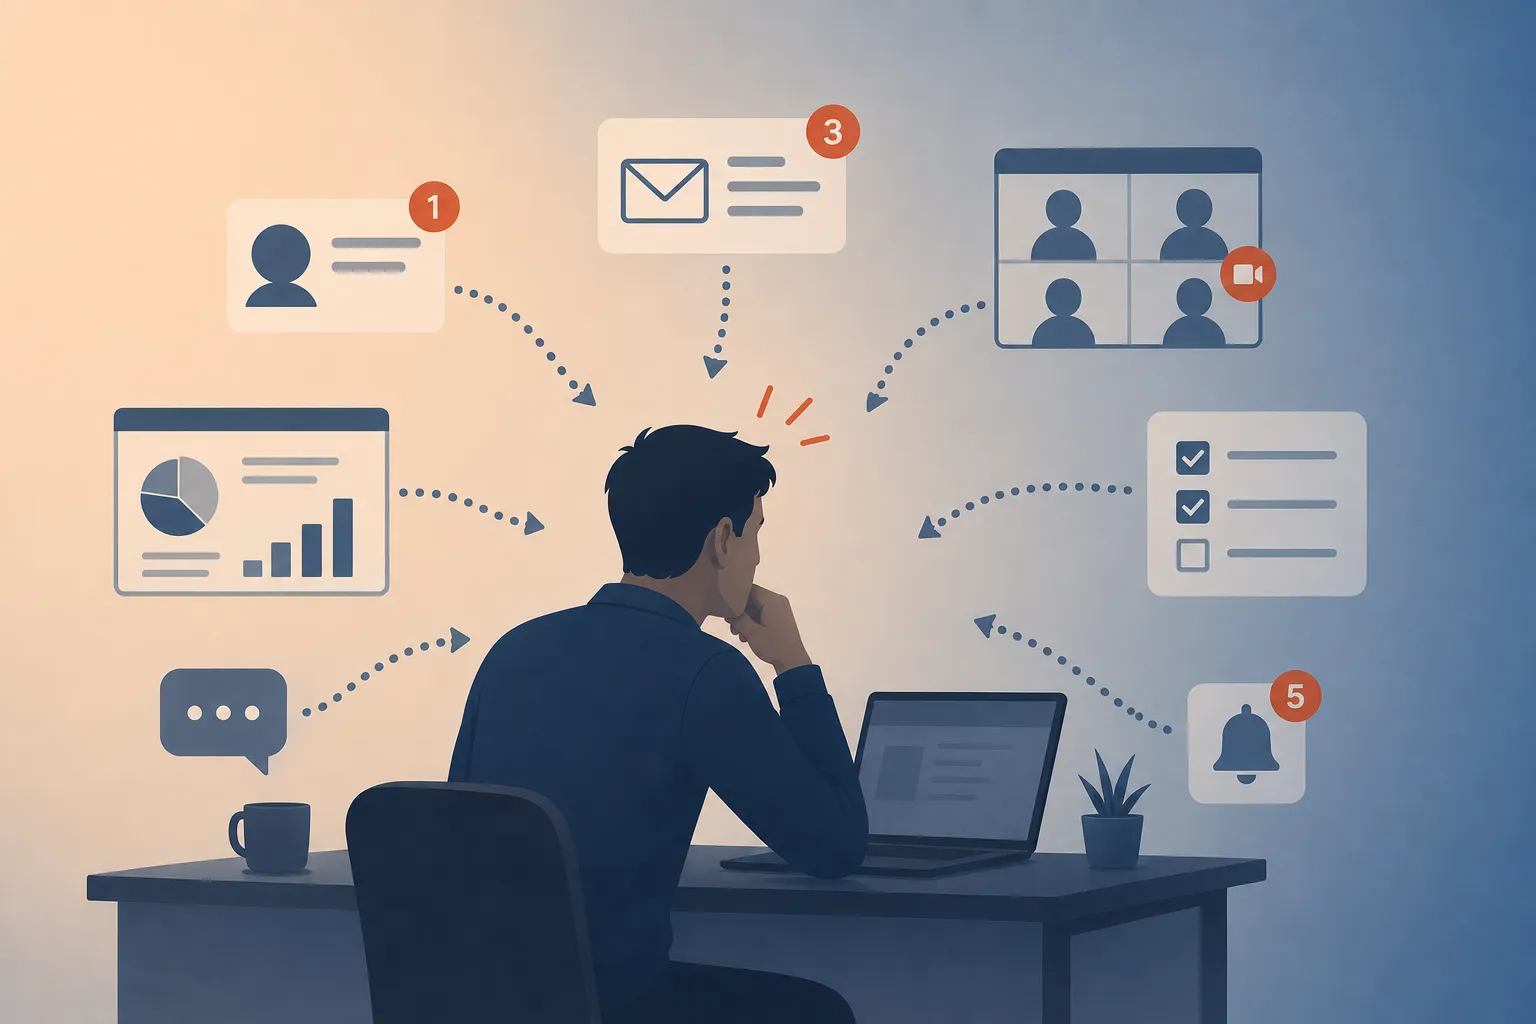
Context switching is one of the hidden causes of productivity decline. Employees may look busy all day while still getting very little meaningful work done. They move from email to chat, from chat to a meeting, from a meeting to a task tool, from a task tool back to email, and then back into another meeting.
Each switch creates friction. The employee has to remember what they were doing, refocus, and rebuild momentum. Over time, too much switching can make work feel more exhausting than the actual workload suggests.
Controlio’s focus and multitasking insights help managers understand which activities interrupt focus. If employees are constantly moving between communication tools, browser tabs, internal systems, and productivity apps, the data can show a fragmented workday.
This is where workforce analytics becomes more useful than simple time tracking. Time tracking may show that an employee worked eight hours. Behavioral analytics can show whether those eight hours were focused, fragmented, or overloaded with interruptions.
When managers see excessive context switching, they can make better decisions. They might create meeting-free blocks, reduce unnecessary notifications, consolidate tools, or adjust workflows so employees have longer stretches of uninterrupted time.
Declining Focus Time
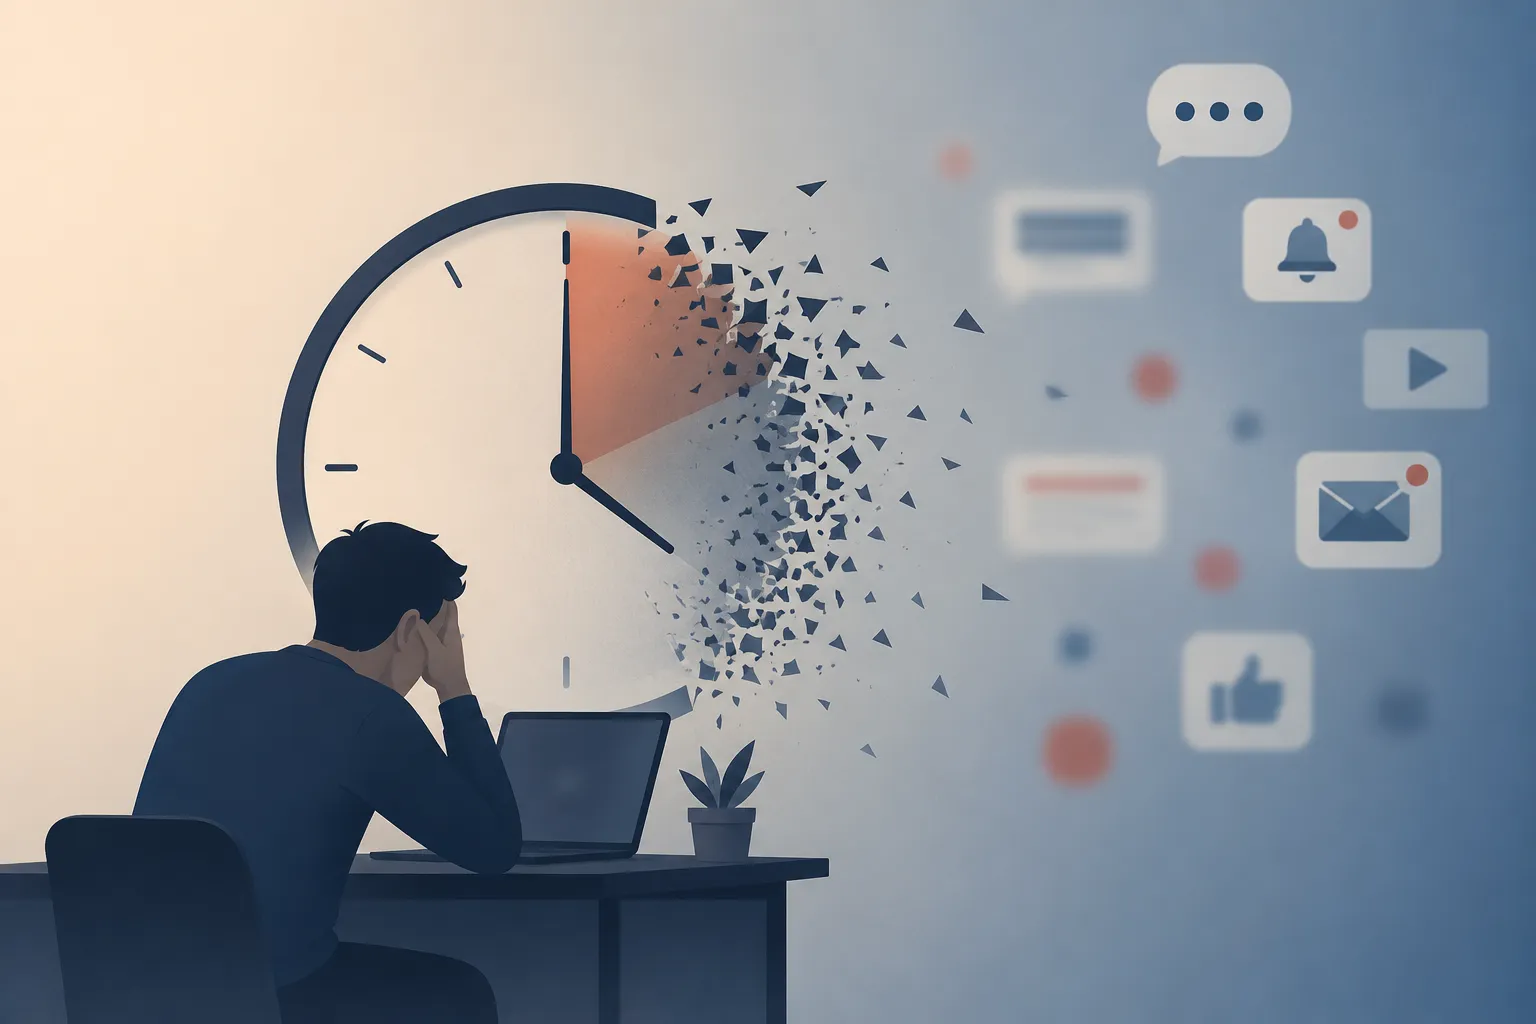
Focus time is one of the strongest indicators of work quality and employee wellbeing. Most people need uninterrupted time to solve problems, write, analyze, design, code, plan, or make decisions. When focus time disappears, productivity often drops even if total work time stays the same.
A decline in focus time can signal several problems. The employee may be stuck in too many meetings. They may be reacting to constant messages. They may be supporting too many projects. They may be spending the day handling urgent but low-value work.
Controlio helps managers analyze daily routines, focus patterns, and multitasking behavior. Instead of only seeing whether someone is active, managers can look at how work is structured across the day.
This is important because burnout is not always caused by workload alone. Sometimes it comes from never having enough mental space to complete important work. Employees may feel like they are working nonstop but never making progress.
By tracking focus time and productivity trends together, managers can see when employees need fewer interruptions, clearer priorities, or more realistic schedules.
Productivity Decline
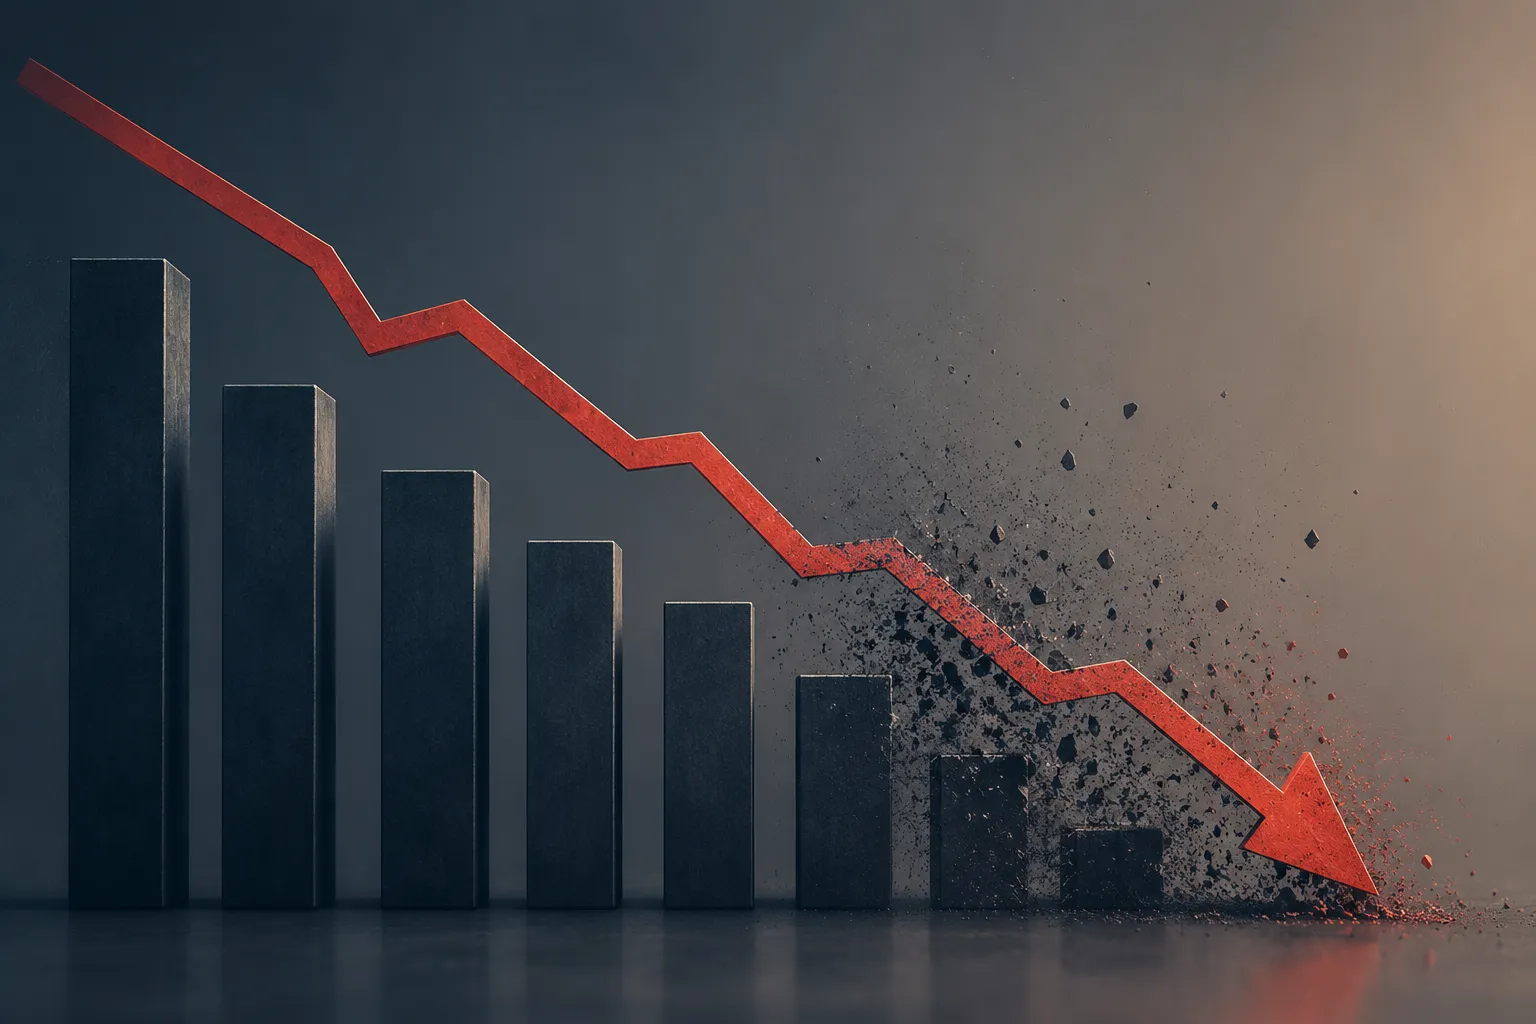
A sudden productivity decline can be easy to misread. Managers may assume an employee is less motivated or less disciplined. But productivity decline can also be a sign that the employee has been overloaded for too long.
This is why productivity monitoring should be viewed in context. A lower productivity score does not automatically mean someone is failing. It may mean the employee is spending too much time in meetings, working too many hours, switching tasks too often, or losing focus because of digital exhaustion.
Controlio’s productivity measurement tools help managers compare productivity across individuals, departments, and time periods. Its productivity widgets and visual reports can show fluctuations, trends, and changes in work patterns.
When productivity starts dropping after a period of sustained overwork, that is an important signal. Managers can use the data as a starting point for a conversation, not as a final judgment.
A healthy approach sounds like this: “I noticed your workload has been high for several days and your focus time has dropped. Do we need to shift priorities or move something off your plate?” That is very different from saying, “Your productivity is down.”
How Controlio Supports Burnout Detection
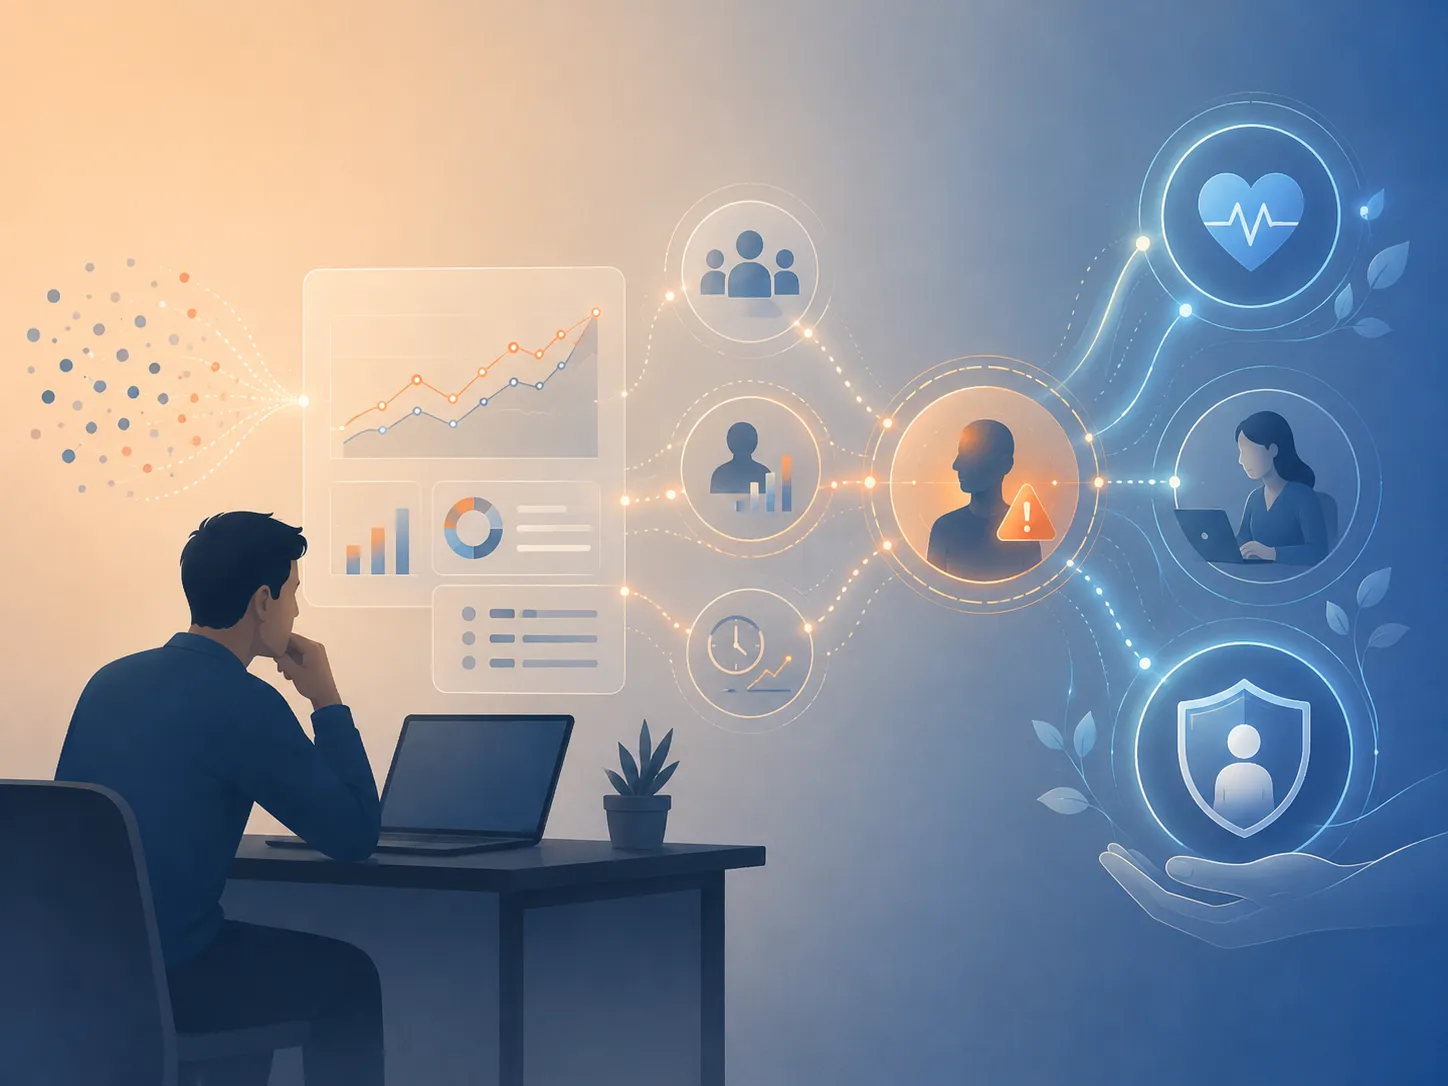
Controlio can act as an early-warning system for workforce health because it connects several important signals in one place. It does not just show whether employees are online. It helps managers understand how employees are working.
The Workload Report and workload-related widgets can help identify overloaded and underloaded employees. This gives managers a clearer view of whether tasks are distributed fairly across the team. If one employee is carrying too much work while others have lighter workloads, managers can rebalance assignments before burnout becomes a retention issue.
Controlio’s Burnout risk control adds another layer by helping teams flag employees who remain overloaded for a set number of days in a row. This is useful because burnout risk is often tied to duration. One difficult day is normal. A long stretch of overloaded work is more concerning.
Focus and multitasking insights help managers see whether employees are getting real concentration time or losing focus to email, messaging, meetings, and other interruptions. Input operation reports can show working patterns based on activity signals such as clicks, keystrokes, copy and paste actions, and other computer usage indicators.
Category distribution can also help teams understand whether employees are spending time in tools that align with their role. If someone’s day is being consumed by communication, administration, or unrelated tasks, managers may need to adjust the workflow.
Together, these features help Controlio move beyond basic productivity monitoring. It becomes a way to understand workload health.
Turning Burnout Analytics Into Action
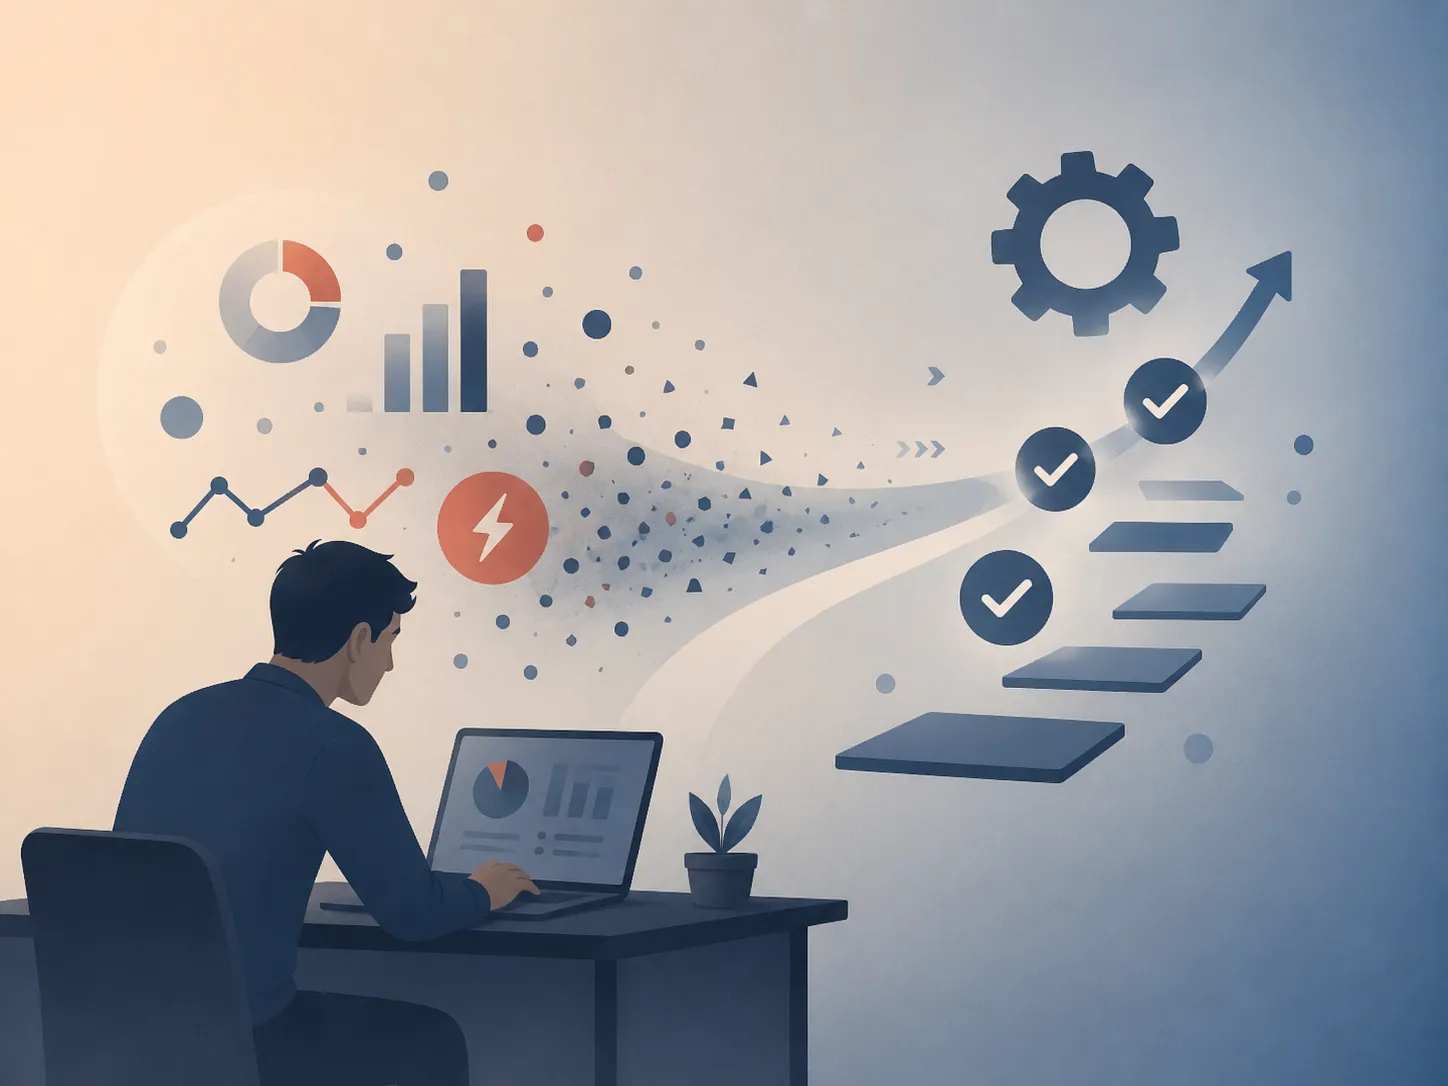
The value of burnout analytics is not in collecting more data. The value is in taking action earlier.
Managers can use workforce analytics to make small adjustments before the situation becomes serious. They can redistribute work, reduce meeting load, protect focus time, encourage breaks, adjust schedules, or add support to overloaded teams.
Controlio’s alerts and behavior rules can also help managers respond in real time. For example, alerts tied to non-stop active time can remind employees to take breaks or help supervisors spot unhealthy work patterns. Productivity and workload reports can help managers review trends during one-on-one meetings.
This turns workforce analytics into a coaching tool. Instead of using data only to measure performance, companies can use it to support healthier work habits.
The best results come when managers use the data with context and empathy. A report can show that something is happening, but a conversation explains why. Maybe an employee is overloaded because another team member left. Maybe meetings are being scheduled over focus blocks. Maybe a process is broken and causing extra work.
Data should start the conversation, not replace it.
Balancing Monitoring and Employee Trust
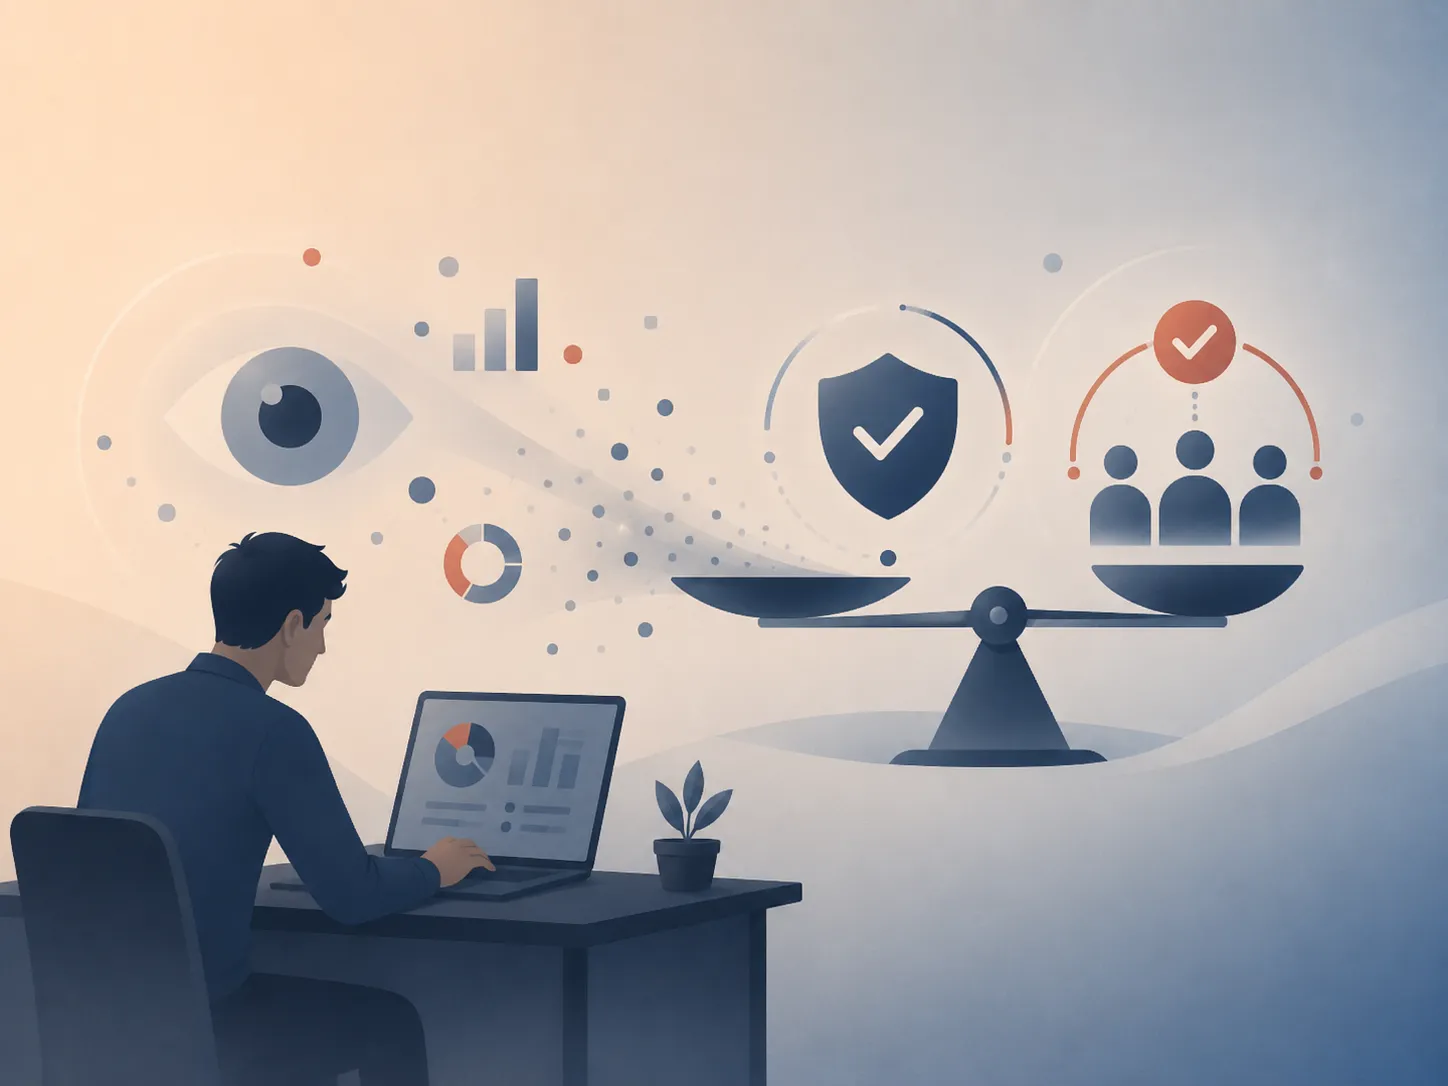
Burnout detection only works if employees trust the process. If workforce analytics feels like employee surveillance software used to punish people, employees may become more stressed, not less.
Companies should be transparent about what is being tracked and why. Employees should understand that the purpose is to improve workload balance, prevent overwork, and support employee wellbeing.
This is especially important when using employee monitoring tools. Managers should avoid treating every data point as proof of a problem. They should look for trends, compare data fairly, and consider the employee’s role, responsibilities, and current workload.
Privacy controls also matter. Not every team needs the same level of visibility. Some roles may require detailed activity monitoring, while others may only need workload and productivity trends. A thoughtful setup helps companies use workforce analytics responsibly.
The goal is not to create pressure. The goal is to create visibility into pressure that already exists.
Why Burnout Prevention Helps Retention
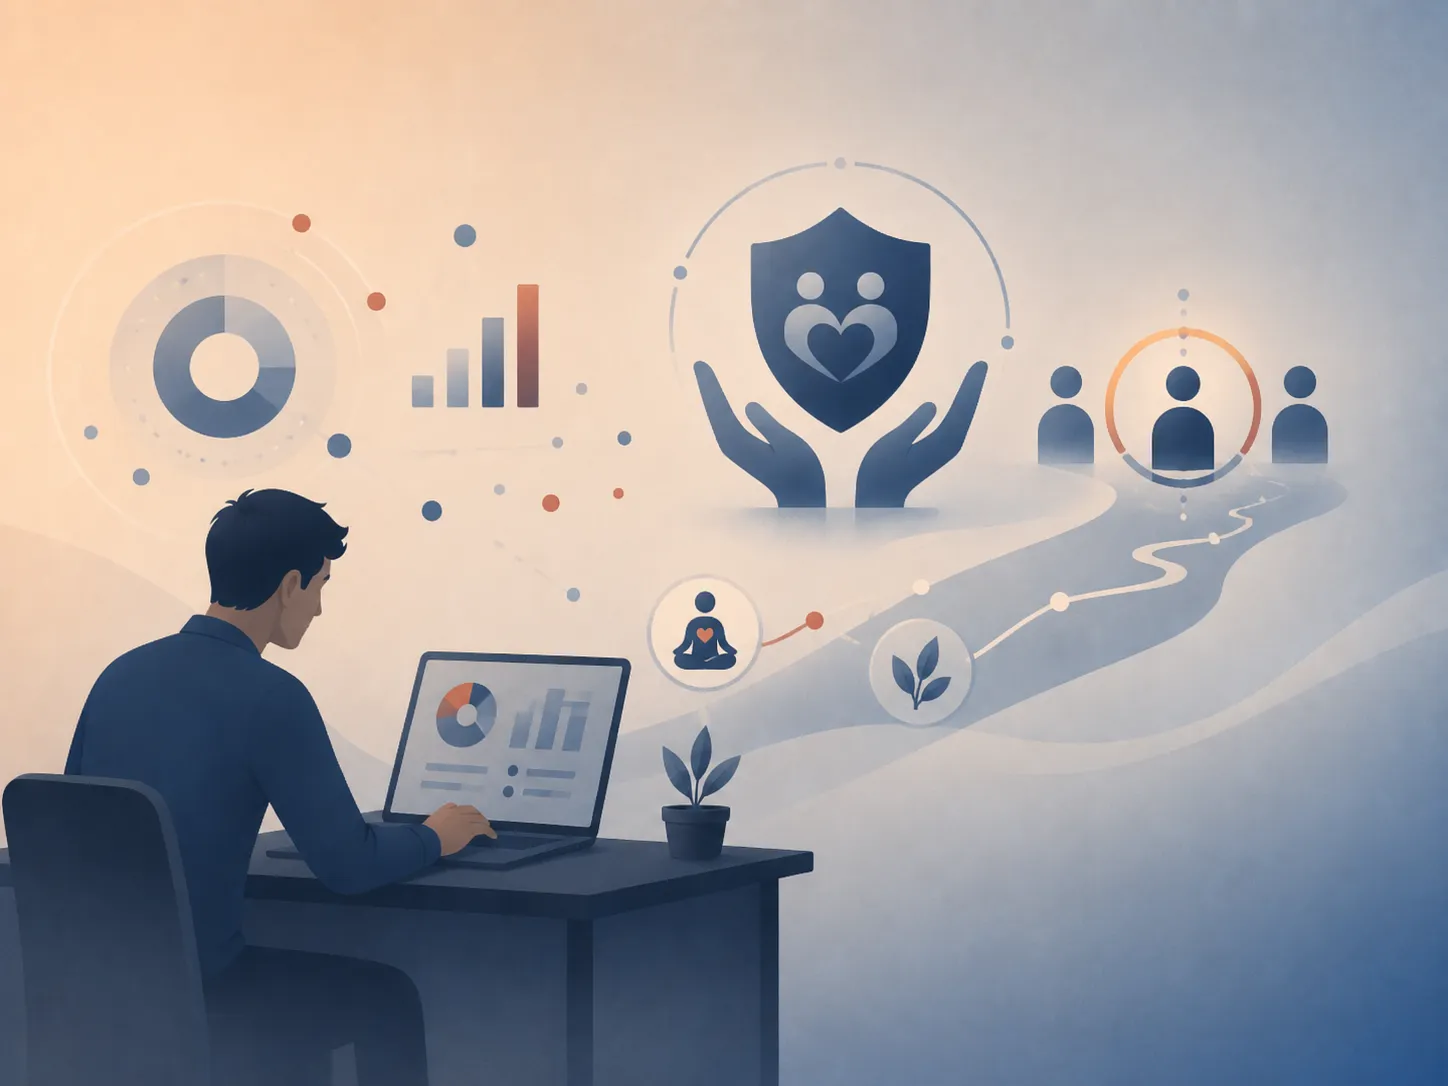
Employee burnout and employee retention are closely connected. When employees feel overwhelmed for too long, they may begin looking for a new job even if they like the company. Burnout can make good employees feel like leaving is the only way to recover.
This is especially risky with high performers. They are often trusted with urgent projects, difficult clients, or extra responsibilities. Because they usually deliver, managers may not notice when the workload becomes too much.
Workforce analytics helps companies see when strong employees are being stretched too far. It can also reveal whether some teams are consistently overloaded compared with others.
By acting earlier, companies can keep good employees from reaching the point where they are already disengaged. This makes burnout analytics not just an employee wellbeing tool, but also a retention strategy.
Preventing burnout is usually less expensive than replacing experienced employees. It also helps protect team morale because burnout rarely affects one person alone. When one employee becomes overwhelmed, deadlines slip, coworkers absorb extra work, and the cycle can spread.
Controlio as a Workforce Health Early-Warning System
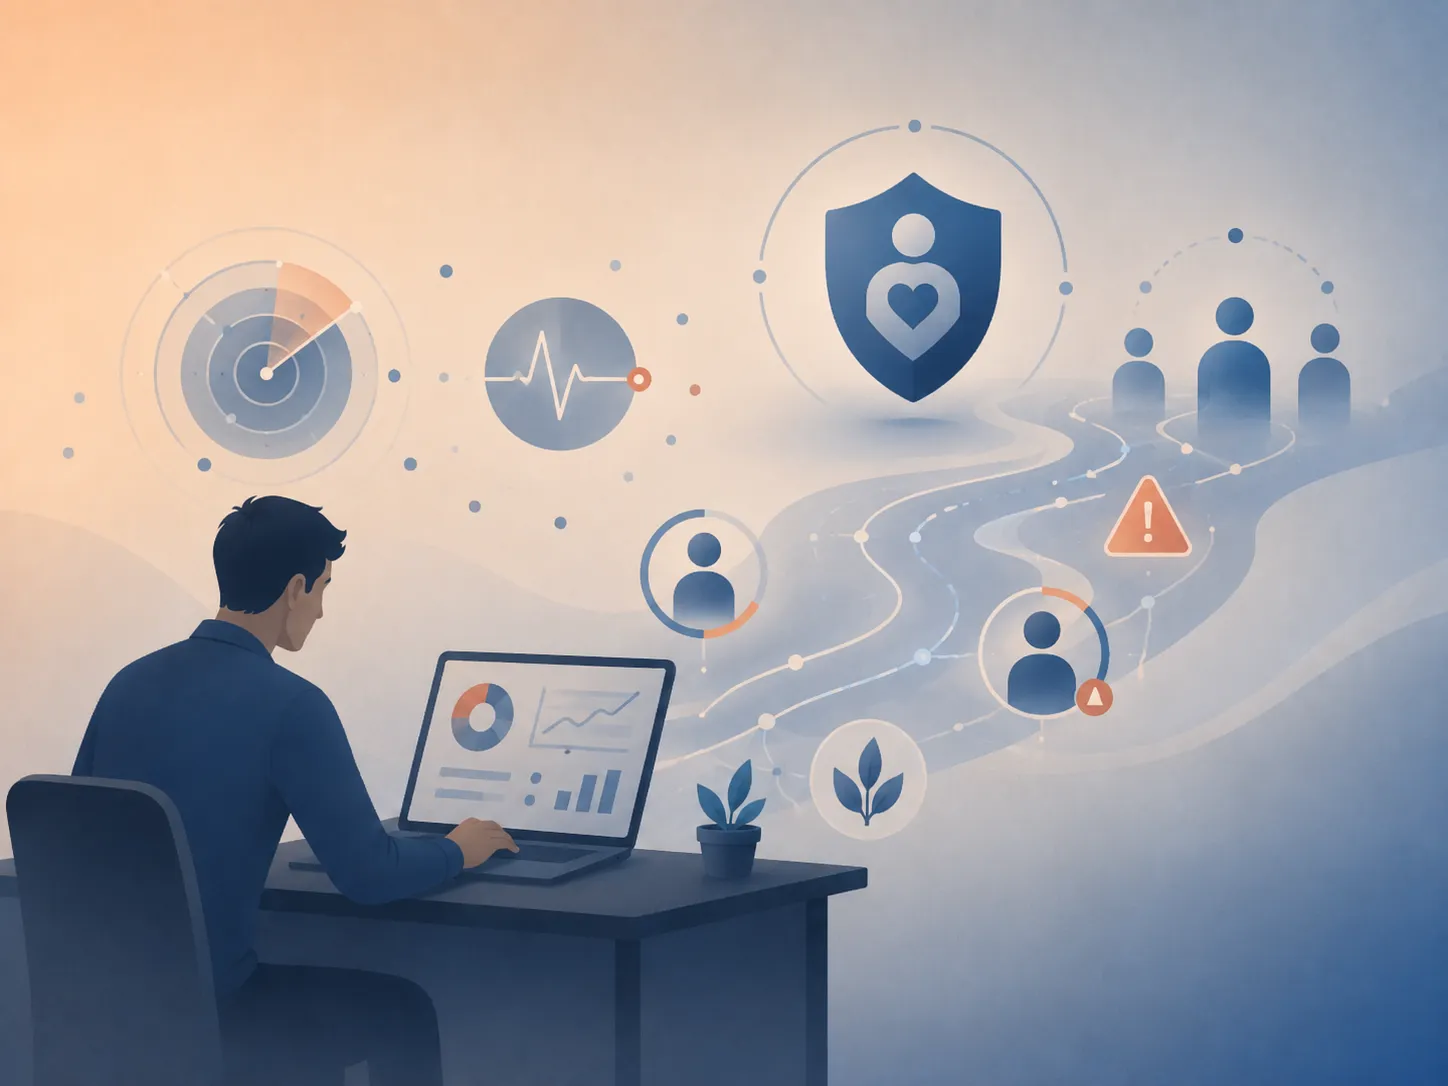
Controlio is not just useful for measuring productivity. It can help companies understand whether productivity is sustainable.
That distinction matters. A team may look productive for a short period because everyone is working late, skipping breaks, and reacting to constant requests. But that level of output may not last. Without the right data, leaders may celebrate the productivity spike while missing the burnout risk underneath it.
Controlio gives companies a more balanced view. Workload reports, productivity trends, focus and multitasking insights, category distribution, work time logging, and Burnouts detection can show whether employees are working in a healthy pattern or drifting toward overwork.
This makes Controlio valuable for managers who want to lead with better information. They can see when employees need support, when workload distribution is uneven, and when productivity decline may be connected to exhaustion rather than lack of effort.
Conclusion
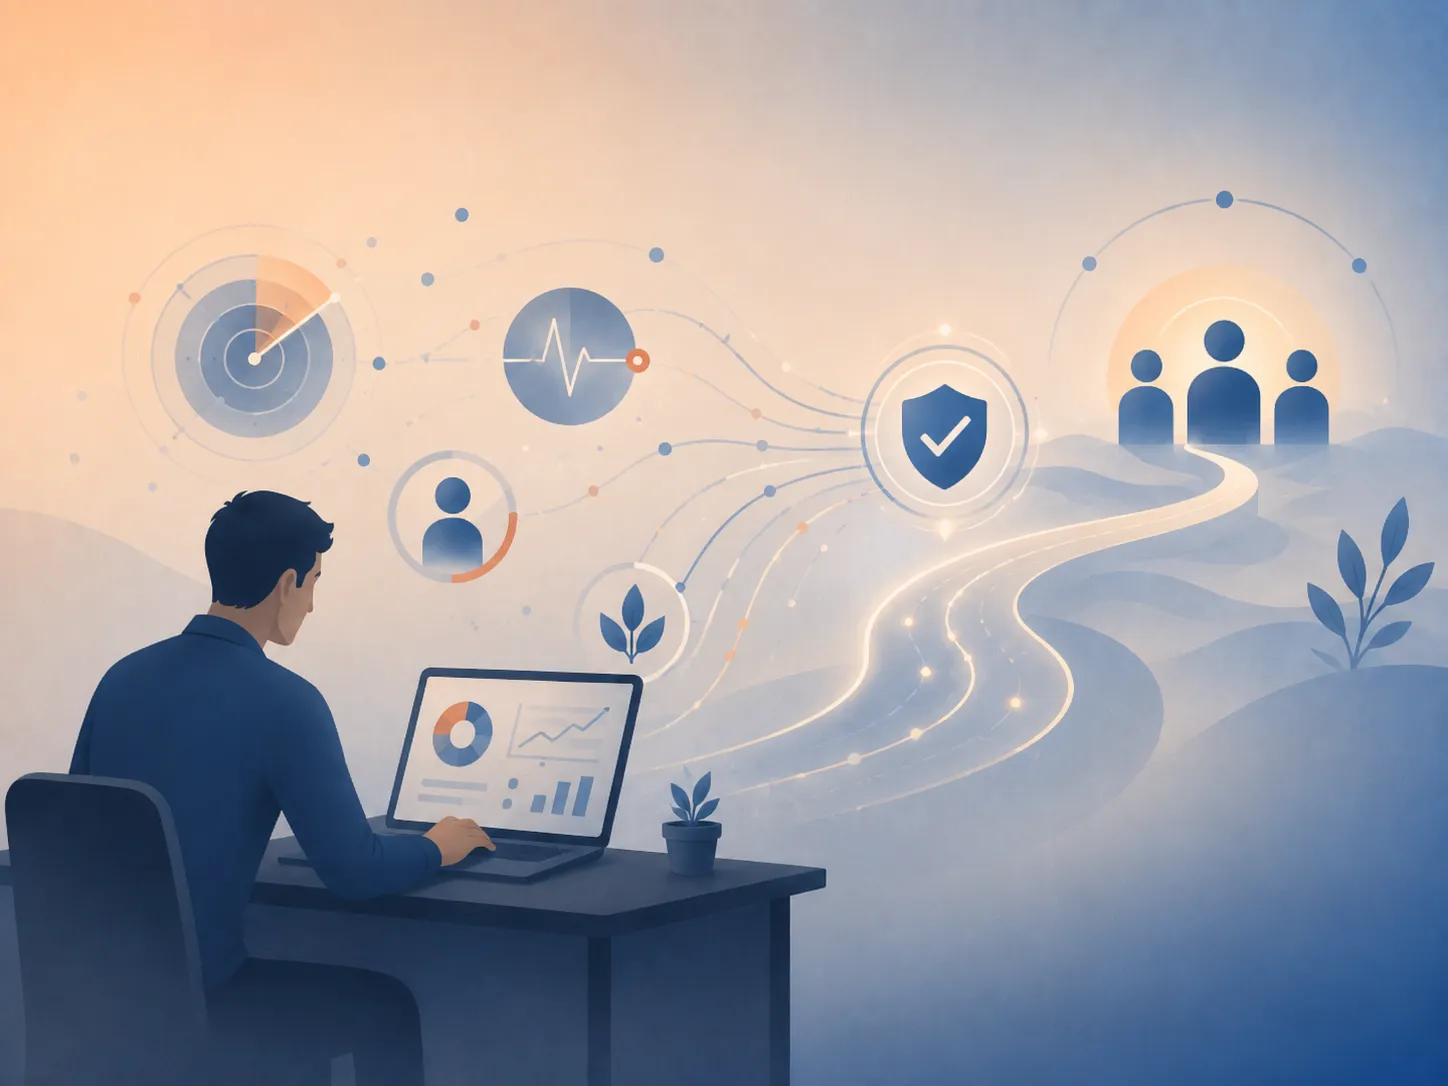
Burnout prevention starts with visibility. Managers cannot fix workload problems they cannot see. They cannot protect focus time if they do not know where the day is going. They cannot reduce digital exhaustion if they only measure whether employees are online.
Workforce Analytics 2.0 gives companies a better way to understand employee burnout detection. It uses behavioral analytics to identify overtime trends, excessive meetings, after-hours work, context switching, declining focus time, productivity decline, and other burnout indicators.
Controlio helps turn those signals into practical insights. With Workload Report data, productivity widgets, focus and multitasking insights, activity tracking, and Burnouts detection, companies can spot early signs of overwork and respond before burnout damages performance, morale, and retention.
The goal is not to monitor employees harder. The goal is to manage work better.
When used responsibly, Controlio gives leaders the data they need to support healthier work habits, balance workloads, protect focus time, and build a more sustainable workforce.
FAQ
What Is Burnout Analytics?
Burnout analytics uses workforce data to identify patterns that may point to employee burnout risk. This can include overtime trends, after-hours work, missed breaks, declining focus time, excessive multitasking, and productivity changes over time.
What Are Common Burnout Indicators at Work?
Common burnout indicators include longer work hours, frequent after-hours activity, reduced focus time, heavy context switching, meeting overload, missed breaks, and a steady drop in productivity or engagement.
How Can Workforce Analytics Help Prevent Burnout?
Workforce analytics helps managers see unhealthy work patterns before they become bigger problems. By tracking workload, focus time, activity levels, and productivity trends, leaders can rebalance work, reduce interruptions, and support employees earlier.
Can Controlio Detect Employee Burnout?
Controlio does not diagnose burnout, but it can help identify early signs of burnout risk. Its workload insights, productivity trends, focus and multitasking data, and burnout risk controls can show when employees may be overloaded for too long.
Why Is Burnout Prevention Important for Employee Retention?
Burnout can cause strong employees to disengage, lose motivation, or leave the company. By identifying overwork and productivity decline earlier, managers can support employees before burnout turns into a retention problem.