The Real Productivity Index: How To Combine Time Tracking, App Usage & Output Metrics Into One Business KPI
For decades, productivity has been reduced to a simple equation: output ÷ hours worked. On paper, it looks straightforward. In practice, especially in hybrid and knowledge work environments, this formula fails to capture what truly drives business performance.
Consider this: two employees log the same eight hours. One spends six of those hours context-switching between chat pings, sluggish applications, and overlapping tasks. The other spends six hours in deep, uninterrupted work on high-value deliverables. Old-school formulas would score them equally, but from an operational efficiency standpoint, they are worlds apart.
This is where organizations evaluating workforce analytics dashboards and time tracking productivity tools have an opportunity. The next generation of productivity measurement doesn’t just track hours, it blends validated time, focus quality, tool friction, and business output into one comparable, finance-ready metric: the Productivity Index.
Controlio’s latest version introduces new features like Workload, Focus vs. Multitasking time and Categories Distribution that make this metric real and actionable.
Why Leadership Needs a Composite Productivity KPI
For department heads, operations leaders, and FP&A teams, productivity isn’t about keystrokes, mouse clicks, or busywork, it’s about understanding how effectively human capital converts into measurable business value.
Leaders are under pressure to justify labor costs, allocate resources wisely, and forecast with precision, yet traditional time-tracking tools rarely provide the financial context needed to support these decisions.
Too often, measurement stops at time tracking and basic activity levels, giving organizations only surface-level visibility. What’s missing is the connection between employee behavior patterns and their real influence on productivity and capacity forecasting. The result: leaders can monitor activity, but can’t see the full impact of that activity.
Controlio bridges the divide between time tracking and true productivity insight. By analyzing how people work, not just when they work, it exposes the behavioral dynamics that define output, engagement, and capacity. Leaders gain a complete view of productivity grounded in human behavior.
This enables not just monitoring, but actionable insight that links employee activity to operational efficiency metrics and financial performance.
For example, FP&A teams can use Controlio’s insights to model how small improvements in focus or workload balance translate into higher project margins, or to identify when tool inefficiencies are inflating the effective cost of labor.
Department heads gain the ability to benchmark teams, compare roles, and prioritize interventions based on where productivity improvements will deliver the greatest financial impact.
This isn’t about watching employees, it’s about giving leaders the decision-ready data they need to align workforce analytics with business objectives, ensuring every hour worked is tied to measurable value creation.
The Four Data Inputs Behind the Real Productivity Index
To make productivity measurable across teams, roles, and projects, Controlio’s framework blends four critical layers of data.
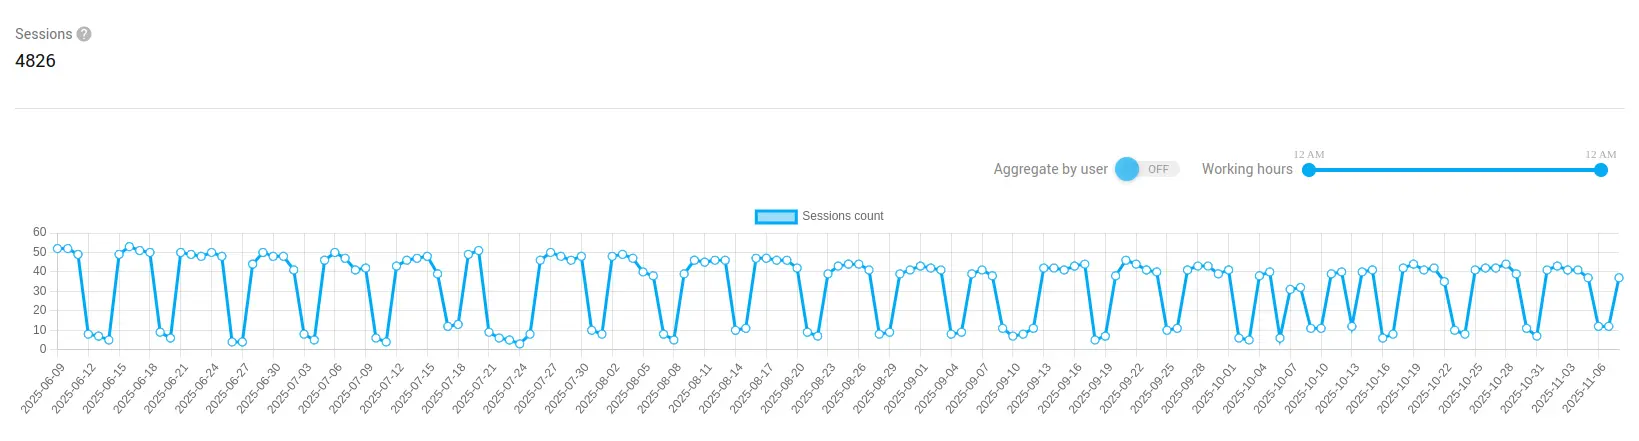
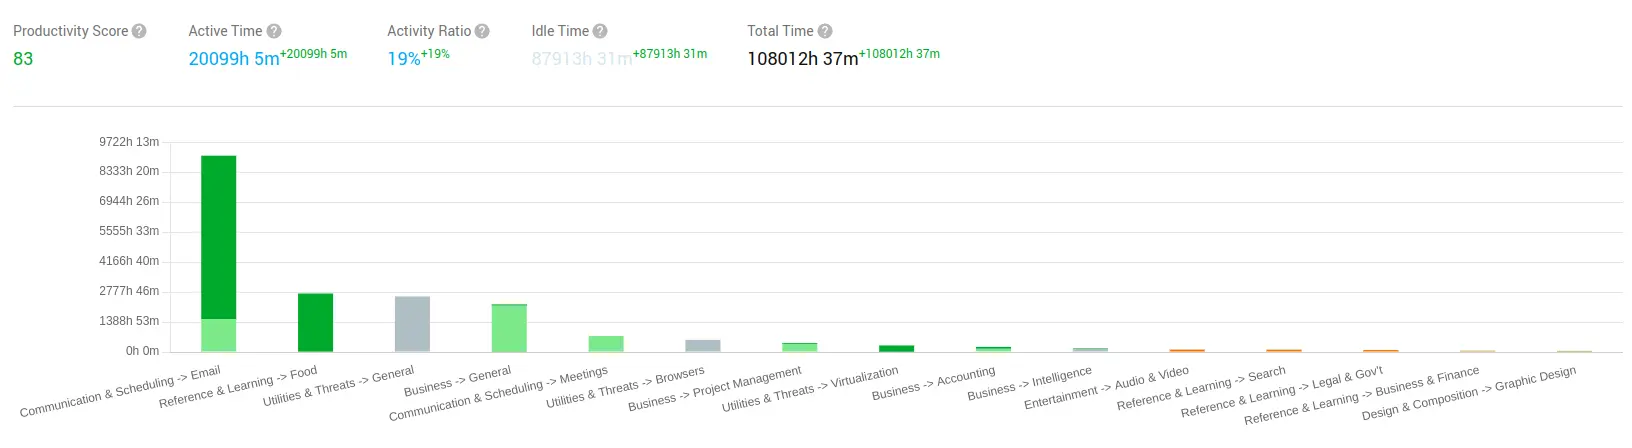
1. Time Fidelity
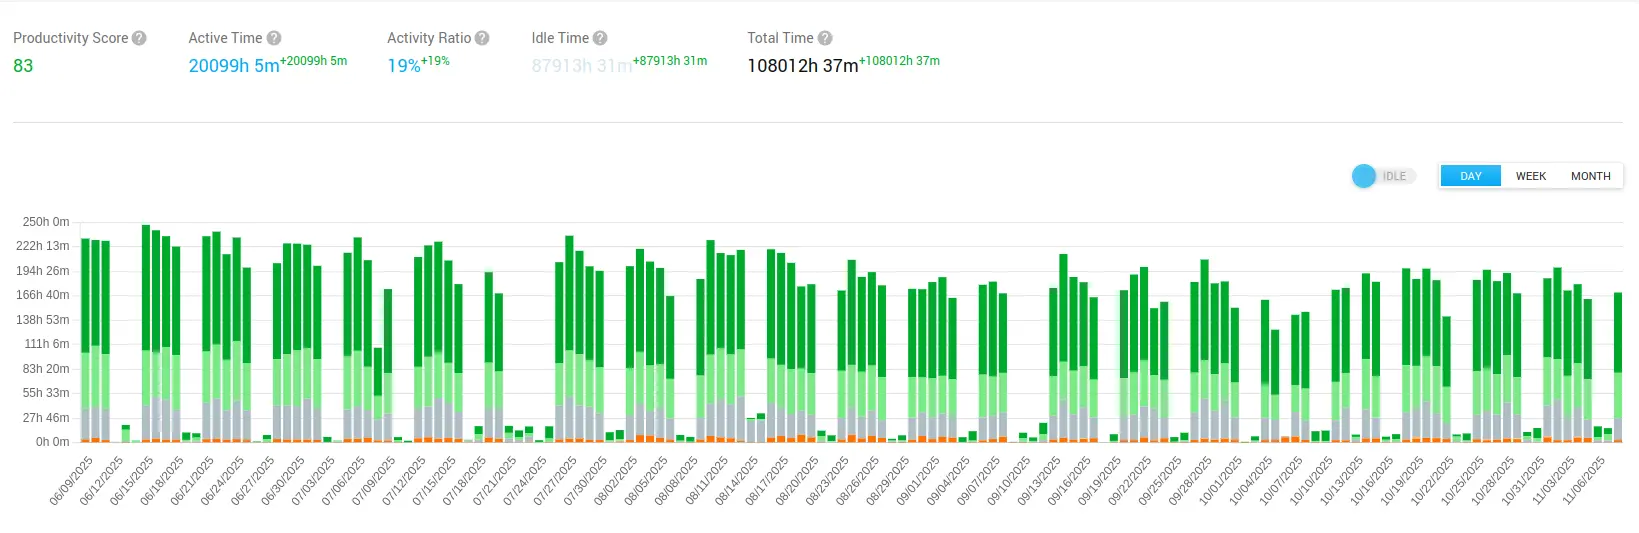
Not all hours are equal. Controlio ensures time data is clean and reliable by tracking:
- Active keyboard and mouse usage.
- Idle time vs. defined breaks.
- Sessions aligned with working-day thresholds.
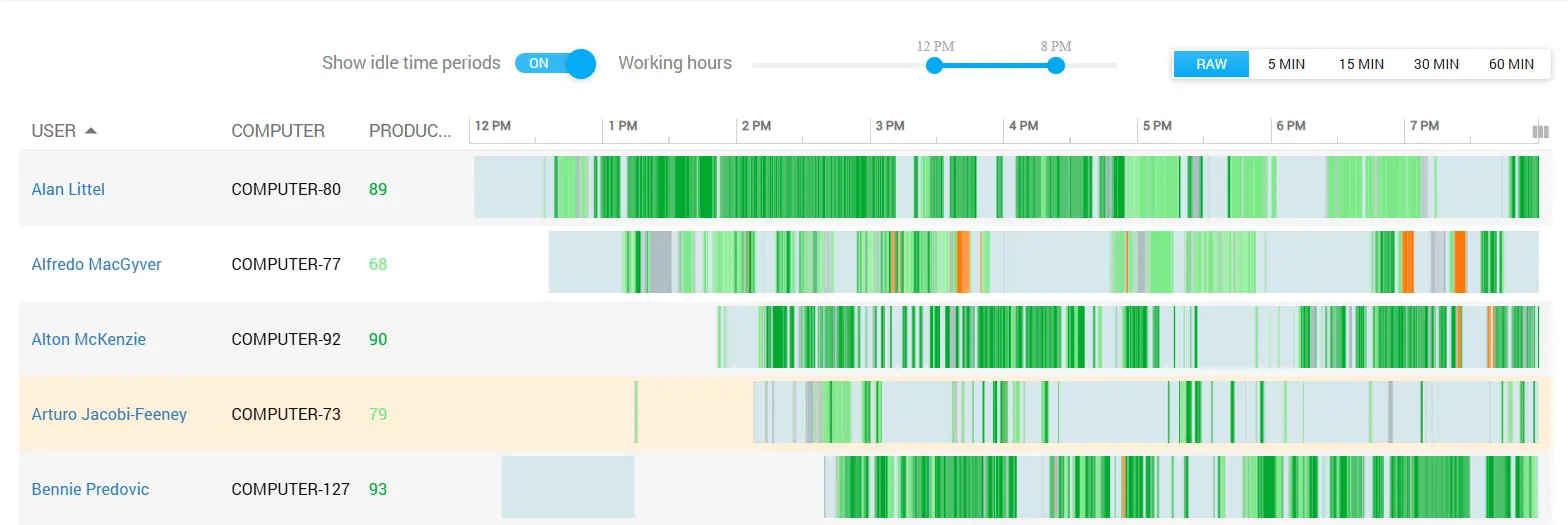
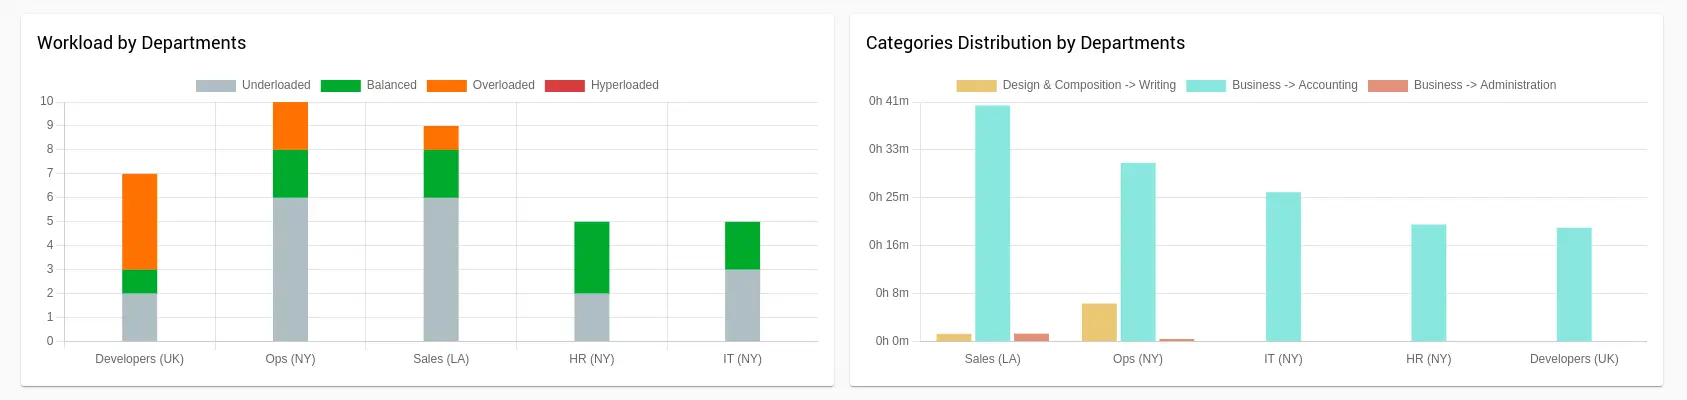
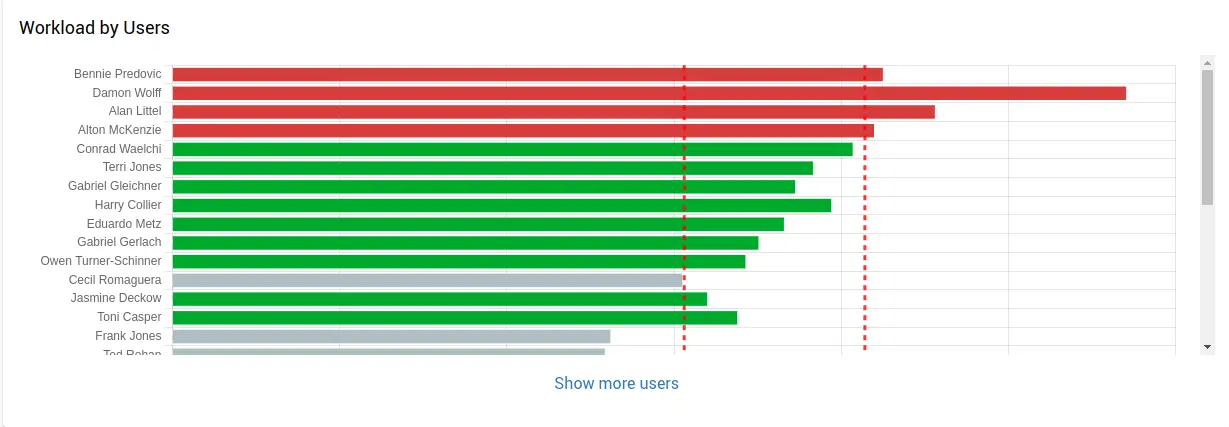
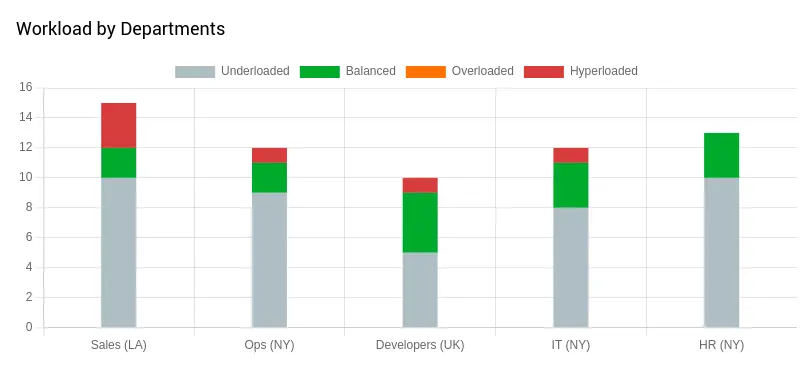
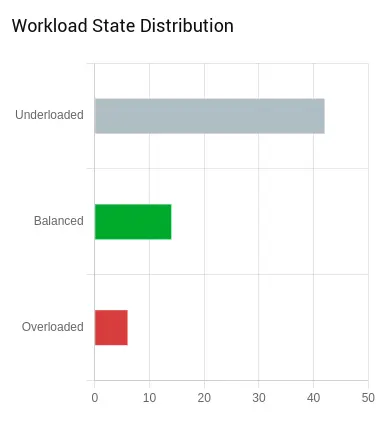
From the Workload feature, time fidelity can be mapped against goal productive time with thresholds that define underloaded, balanced, or overloaded states.
- Underloaded (gray): actual time below goal.
- Balanced (green): time within range.
- Overloaded (orange): time above goal.
- Hyperloaded: extended overload incidents tied to burnout risk.
This alone provides a baseline for labor productivity calculation, but it’s only one layer.
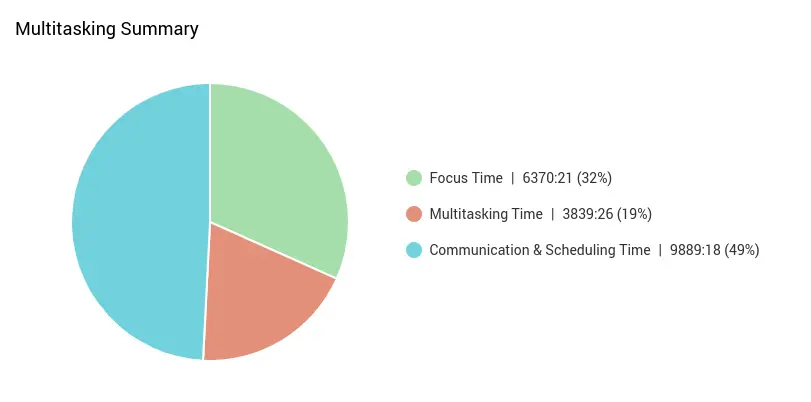
2. Focus Quality
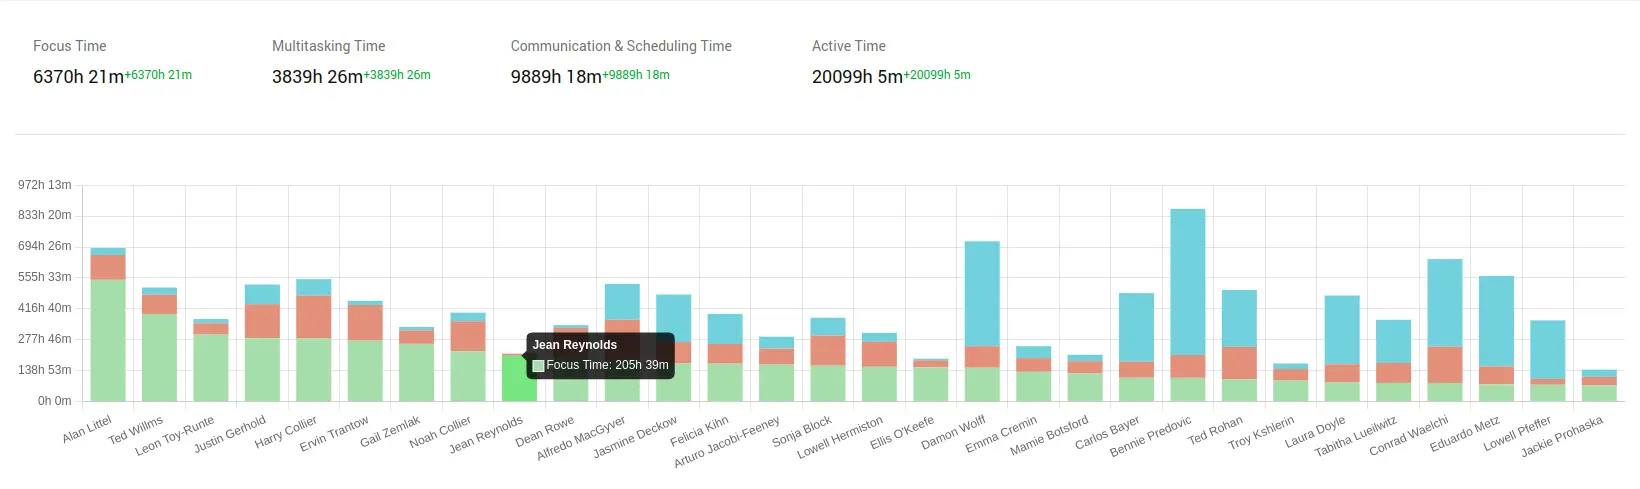
Knowledge work thrives on focus. Controlio’s new Focus vs Multitasking time analysis measures whether employees are:
- Staying engaged in a single workflow.
- Or splitting attention across simultaneous tools and contexts.
- When coupled with burnout indicators from the Workload feature (hyperload streaks, risk of burnout ratios) focus quality becomes measurable and trendable across departments.

For example, FP&A leaders can quantify the cost of lost productivity by modeling how a 5% increase in focus time translates into higher output with the same labor expense.
3. Tool Friction
Productivity isn’t just about the person, it’s about the ecosystem of tools they rely on.
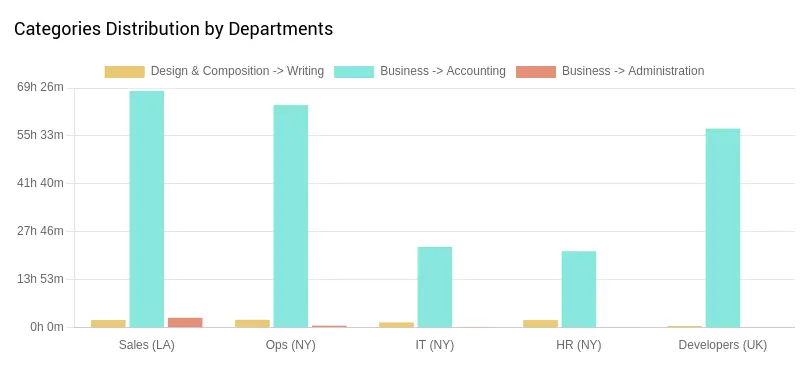
Controlio’s Categories Distribution insights break down app usage into functional categories (CRM, email, dev tools, collaboration platforms, etc.). Leaders can see:
- Which apps consume the most time relative to output produced.
- Latency or inefficiencies in workflows that drain attention.
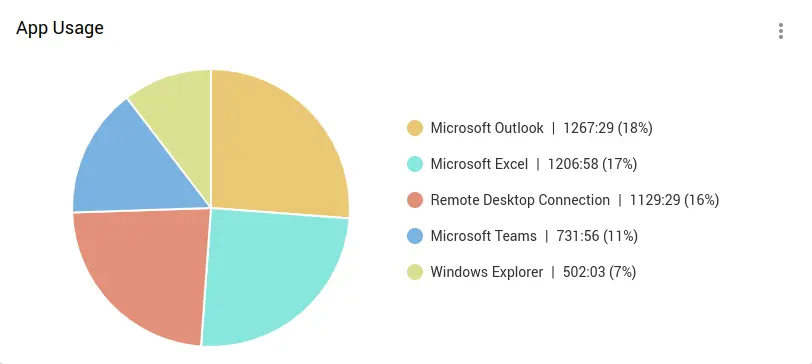
This converts “time spent in apps” from a compliance metric into a friction index, critical for decisions on software investments and operational efficiency.
4. Business Output
Finally, the most important piece: output. Unlike other platforms, Controlio encourages organizations to map productivity units directly to financial models:
- Completed projects.
- Sales booked.
- Reports finalized.
- Tickets resolved.
By combining these outputs with the first three inputs, organizations can calculate a weighted Productivity Index that ties directly into revenue per labor hour and project margin.
The Weighted Productivity Index Formula
Here’s a simplified example of how the Index can be constructed:
- Time Fidelity (30%): validated productive time ÷ goal productive time.
- Focus Quality (30%): % of focused sessions vs. multitasking signals.
- Tool Friction (20%): weighted score of app efficiency and categories distribution.
- Business Output (20%): output units achieved ÷ expected units.
This weighting can flex depending on role meaning developers may skew toward focus, sale toward output. We recommend testing the formulas by customizing them to reflect the specific scenarios and needs of each department.
Scenario Modeling: Focus Gains vs. Cost Cuts
A common decision point for business leaders is whether to drive higher productivity by reducing labor costs or by improving employee focus. On the surface, a 5% reduction in labor costs appears attractive because it immediately lowers expenses. However, FP&A models often reveal that this strategy carries hidden trade-offs.
Cutting headcount or hours can diminish overall capacity, reduce institutional knowledge, and create delivery bottlenecks that slow down project throughput. Over time, the apparent cost savings may erode customer satisfaction and revenue potential, leaving the business less agile in competitive markets.
By contrast, improving focus quality by just 5% generates additional deep-work sessions without the need to increase headcount. These are the moments where employees engage in uninterrupted, high-value work that directly contributes to output metrics such as completed projects, resolved tickets, or revenue booked.
Controlio’s Focus vs. Multitasking time data shows exactly how often employees are context-switching versus concentrating on single workflows, allowing leaders to model the financial impact of reducing distraction at scale.
For example, a modest boost in focus can compound across hundreds of employees, effectively unlocking the equivalent of several full-time roles’ worth of productive hours, without the cost or risk of new hires. In most cases, this yields a greater and more sustainable improvement in project margins and revenue per labor hour than labor cuts alone.
With Controlio’s workforce analytics dashboard, leaders can simulate both approaches side by side, quantify the long-term risks and benefits, and tie outcomes directly back to the metrics finance leaders care about most. This turns what was once an abstract management debate into a clear, data-driven decision.
How Controlio Data Feeds FP&A Dashboards
Controlio isn’t just an HR monitoring tool, it’s a bridge that connects day-to-day workforce activity with the financial outcomes that matter to executives and FP&A teams.
For years, the gap between employee-level productivity data and finance metrics like margin, revenue per labor hour, and capacity forecasts has been difficult to close. Controlio fills that gap by providing clean, structured data streams that integrate seamlessly into BI platforms and financial planning models.
Operational Efficiency Metrics
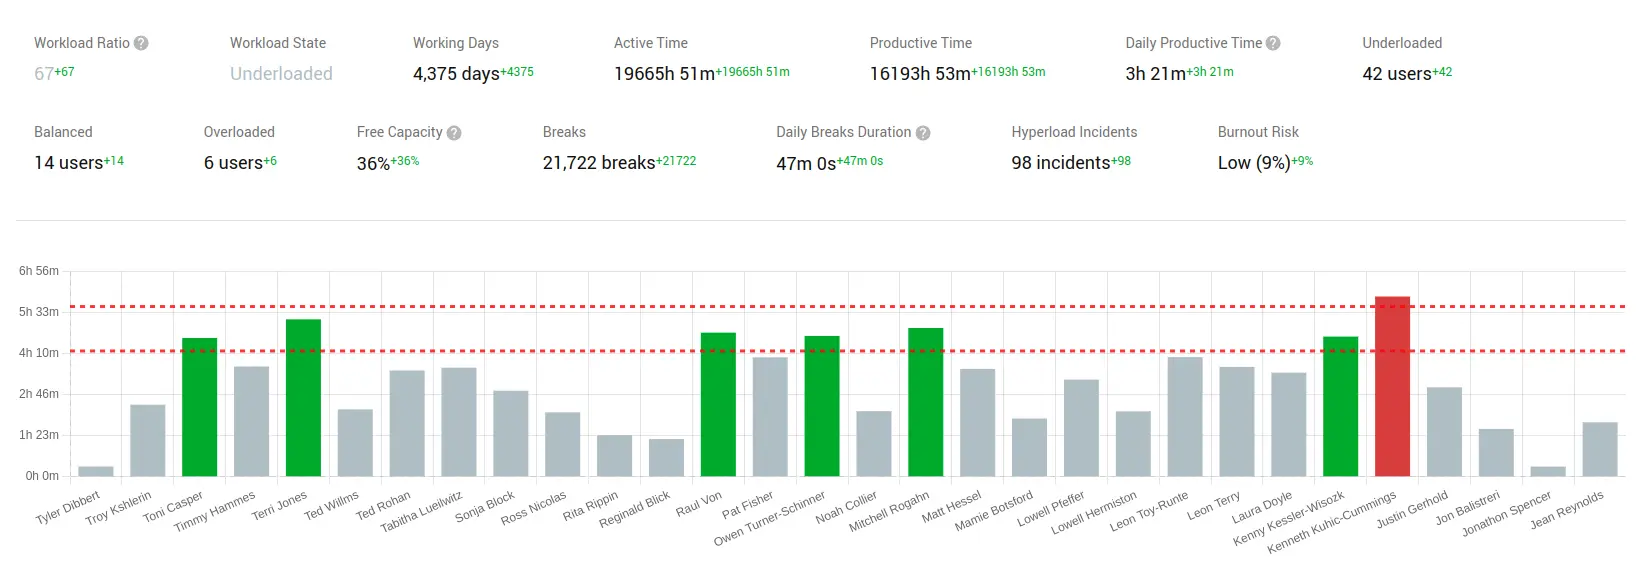
Controlio’s Workload ratios provide a precise measure of whether employees are underloaded, balanced, or overloaded compared to goal productive time.
This is more than a performance score, it becomes a capacity signal for FP&A leaders. For example, if a department shows a high percentage of underloaded users, it indicates free capacity that could be redirected to other projects without additional hiring.
Conversely, prolonged overloads may trigger the risk of burnout, reducing efficiency over time and raising hidden costs like turnover or absenteeism.
Forecast Capacity
Burnout indicators are particularly powerful when tied to financial models. Controlio tracks Hyperload incidents, stretches of consecutive overloaded days that increase burnout risk, and calculates a burnout risk ratio.
For FP&A teams, this provides a forward-looking measure of where delivery bottlenecks may occur, helping adjust headcount forecasts, vendor spend, or project timelines before problems surface. Instead of waiting for attrition or delays to hit financial results, leaders can act proactively with Controlio’s early warnings.
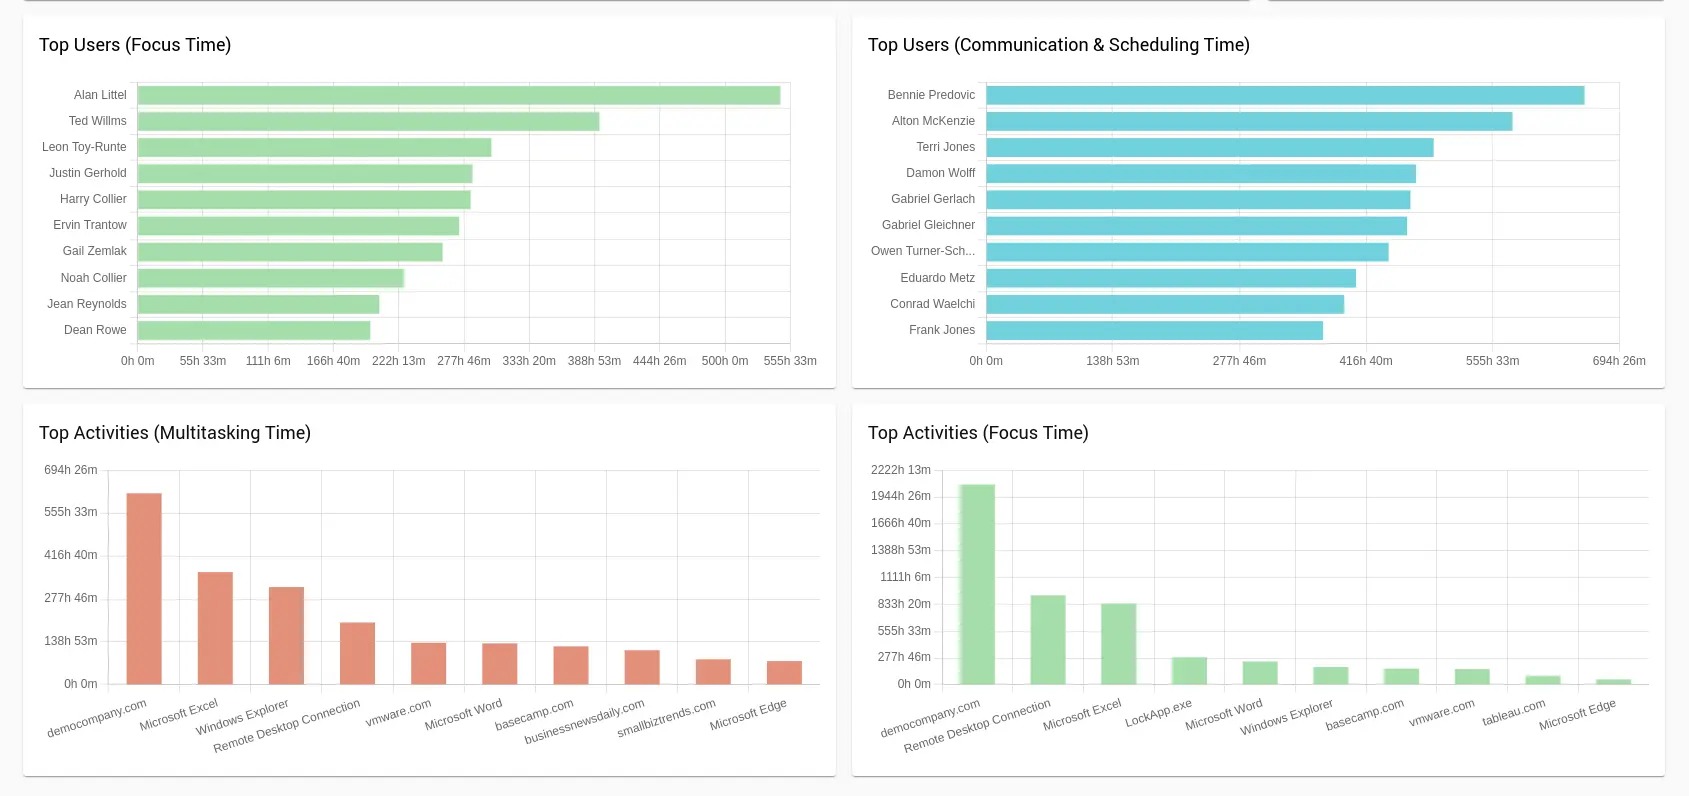
Productivity Benchmarks
Beyond individual teams, Controlio enables cross-department comparisons through its Categories Distribution and Focus vs. Multitasking time features.
Finance teams can see how much time sales spends in CRM tools compared to admin work, or how engineering balances deep focus sessions versus multitasking across platforms.
These benchmarks feed into quarterly business reviews and budget justifications, allowing leaders to compare productivity not just against hours worked but against industry-relevant benchmarks of operational efficiency.
Finally, because all of this data is exportable into BI tools and finance systems, FP&A teams can build dashboards that integrate employee productivity metrics directly into margin analysis and capacity planning models.
This transforms productivity data from a siloed HR metric into a true financial KPI. For example, FP&A leaders can run scenario analyses that show how a 3% improvement in focus quality across a department translates into higher project margins, or how reducing tool friction lowers the effective cost of labor.
With Controlio, workforce analytics no longer live in isolation, they become part of the same models that drive executive decision-making and shareholder reporting.
Closing the Gap Between Workforce Analytics and Business KPIs
Traditional productivity metrics, such as output divided by hours worked, are no longer sufficient in today’s complex, hybrid, and digital-first workplaces. These formulas oversimplify performance by ignoring key factors like how work is distributed, how employees stay engaged, and how technology either accelerates or slows down progress. The result is that leaders end up with numbers that look neat on paper but don’t reflect the reality of business performance.
By layering time fidelity, focus quality, tool friction, and business output, Controlio delivers a composite Productivity Index that captures the full spectrum of how work gets done.
This isn’t just a way to compare employees, it creates a benchmark that can be rolled up by team, department, or role, and then tied directly to financial models like margin analysis, revenue per labor hour, and project profitability forecasts.
Controlio’s Workload ratios add even more depth by revealing whether employees or teams are underloaded, balanced, or overloaded against defined productivity goals. This visibility helps leaders understand not only how much capacity is available but also where risks of burnout may undermine performance if overload continues.
The inclusion of Focused vs. Multitasking operations introduces a vital measure of quality: whether people are engaging in uninterrupted, high-value work or losing time to constant context-switching. These insights allow managers to quantify the true cost of distraction and make informed decisions on resource allocation, training, or process redesign.

Meanwhile, Categories Distribution shows where time is being spent across different tools and workflows, helping organizations identify inefficiencies caused by overlapping platforms or underperforming systems. This turns raw usage data into actionable intelligence that can inform both IT investments and process optimization initiatives.
When these dimensions are combined, productivity metrics evolve from being HR-centric numbers into finance-ready indicators. Instead of merely reporting how much time was tracked, Controlio empowers leaders to measure the impact of that time on business outcomes.
The gap between workforce analytics and business KPIs is closed, creating a seamless link between daily employee activity and the strategic goals of the organization.
Turning Productivity Index into Benchmarks and Continuous Improvement
Calculating a Productivity Index is just the beginning. The real value emerges when organizations use these Indexes to create benchmarks that inform ongoing improvement. With Controlio, productivity metrics are not static snapshots, they evolve into a living baseline for measuring progress over time and across teams.
For example, once a department establishes its baseline Productivity Index, leaders can track the effects of operational changes such as introducing new collaboration tools, restructuring workflows, or adjusting staffing levels.
Did focus quality improve after implementing meeting-free mornings? Did tool friction decrease when migrating to a single CRM platform? These changes become quantifiable, enabling leaders to separate real gains from assumptions.
Controlio also supports internal benchmarking. Teams can compare productivity within the same department to identify high-performing groups, or benchmark across roles and regions to highlight best practices.
For FP&A leaders, these insights translate into more confident forecasts and targeted investment decisions. Instead of cutting costs blindly, organizations can pinpoint the processes, tools, or practices that yield measurable productivity gains.
Most importantly, benchmarking with Controlio turns productivity from a one-time report into a continuous improvement cycle. Indexes highlight where teams excel and where they struggle, feeding a loop of analysis, intervention, and measurement.
Over time, this builds a culture where productivity isn’t about surveillance, it’s about enabling people to do their best work while ensuring leaders have the financial clarity to guide growth.
Final Thoughts
Ready to see how the Real Productivity Index can impact your bottom line? Start by exploring the Controlio demo dashboard. Controlio makes it easy to move from insights to action.