Employee Productivity Benchmarks by Function (Industry): 2026 Study
-2026-Study.webp)
Key Takeaways
- Productivity benchmarks should be compared by function, not across the entire organization.
- Employee productivity statistics are most valuable when paired with industry productivity metrics and workforce KPIs.
- Remote work productivity and hybrid work benchmarks differ because work environments influence focus time.
- Operational productivity should be evaluated alongside employee efficiency, collaboration, and burnout risk.
- A benchmark report provides context—not judgment—for workforce performance benchmarks.
Employee productivity benchmarks provide context that raw productivity scores cannot. A productivity score can tell you very little on its own. A team that logs an eighty percent active time may be engaged in high-quality, focused work or sitting through back-to-back meetings leaving them little room to do anything else. Managers need a standard to measure against in order to determine if a number is good, bad, or a cause for concern.
Benchmarks help address this issue. There were several studies released in 2026 measuring behavioral work data from hundreds of thousands of workers across dozens of countries and the results were clear; productivity varies based on the type of work, the industry in which the work takes place, and the structure of the workday. For example, a benchmark created for use in a BPO call center will provide little insight to a manager regarding a finance team or a software development team.
This report uses available 2026 benchmark data across various sales, marketing, finance, customer service and technology functions. Additionally, it examines the effects of remote, hybrid, and in-office work arrangements on the numbers and how Controlio can assist managers in applying these benchmarks to their teams rather than making assumptions.
This benchmark report combines employee productivity statistics, industry productivity metrics, workforce performance benchmarks, remote work productivity, hybrid work benchmarks, employee efficiency, operational productivity, and workforce KPIs to provide a practical framework for evaluating modern teams.
2026 Productivity Benchmarks Overview
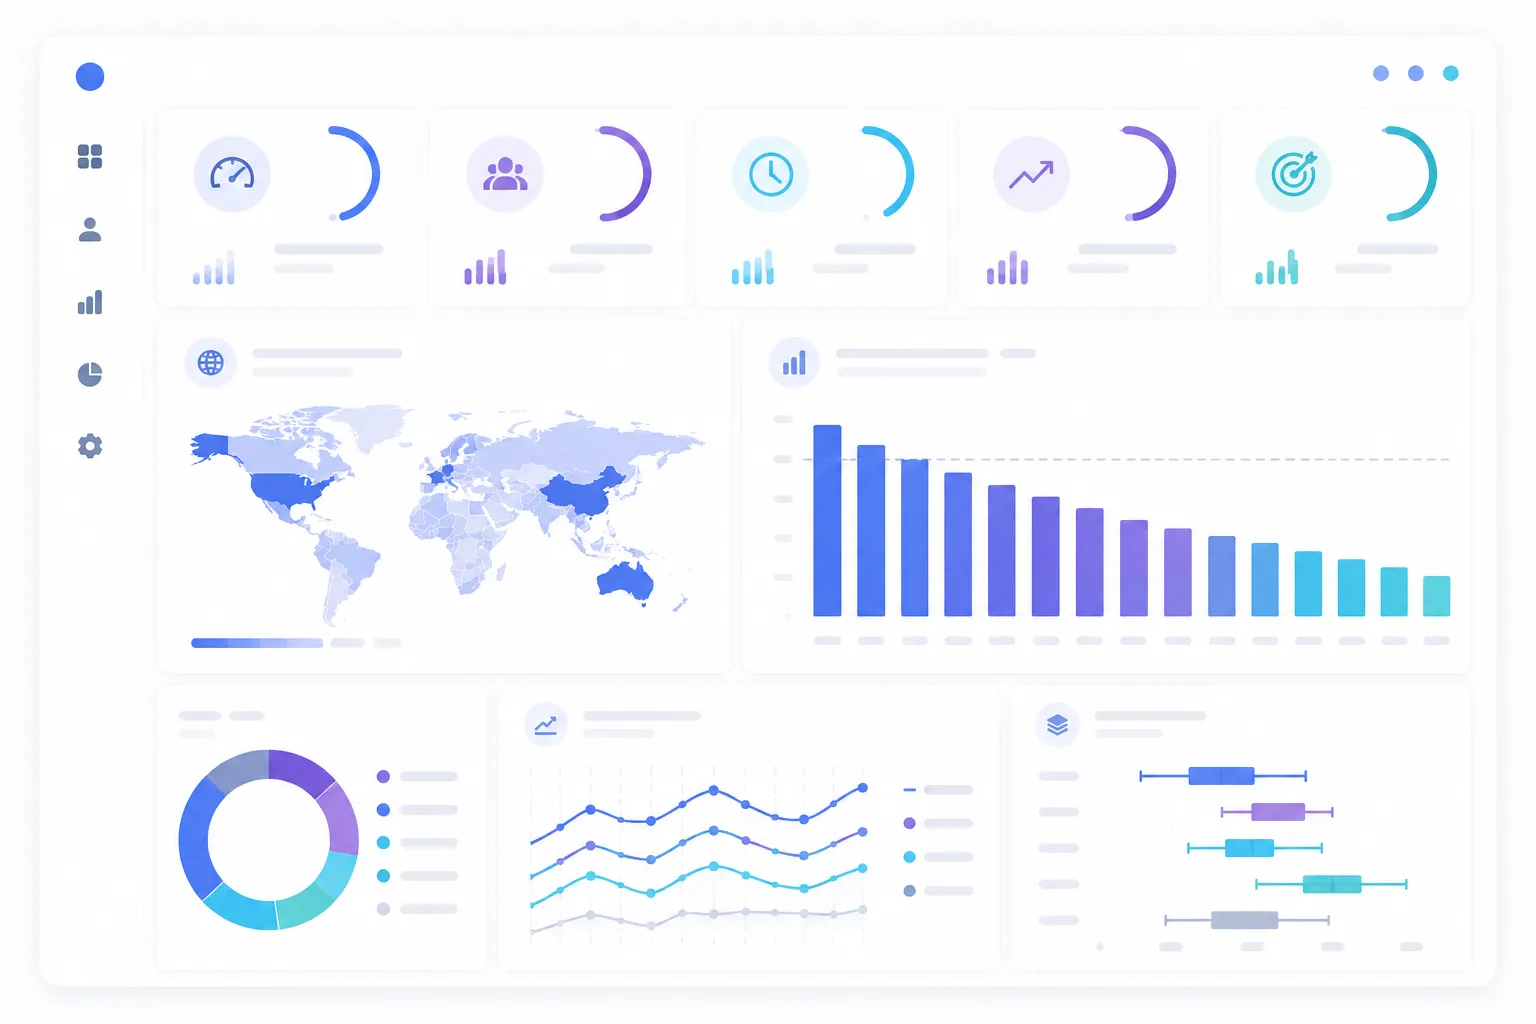
Prior to reviewing each function individually, below is a general overview of where 2026 benchmark data stands in terms of major industries and job functions:
- Sales: The majority of sales teams' idle time is greater than 60% due primarily to meeting loads versus employee disengagement.
- Marketing: The marketing function has the greatest amount of AI utilization along with the greatest burn-out potential in the data.
- Finance: The finance function has a productive-time ratio close to 90%, and there is relatively little utilization of AI by finance personnel.
- Customer Service/BPO: These two functions have the largest productive-time ratios in the data with average handle times ranging from approximately six minutes per phone interaction and less than five minutes per chat session.
- Software/Engineering: Software and engineering teams generate high individual outputs with collaborative time accounting for less than 12% of total work hours; however, there is a significant risk of developing knowledge silos.
- Remote Workers: Remote employees report higher levels of engagement and spend a larger percentage of the day in "deep focus" relative to hybrid and onsite employees.
Each of these numbers indicates different things based on how the role is organized. Therefore, a single company-wide productivity goal rarely applies to all teams.
Why Benchmarks Matter More in 2026
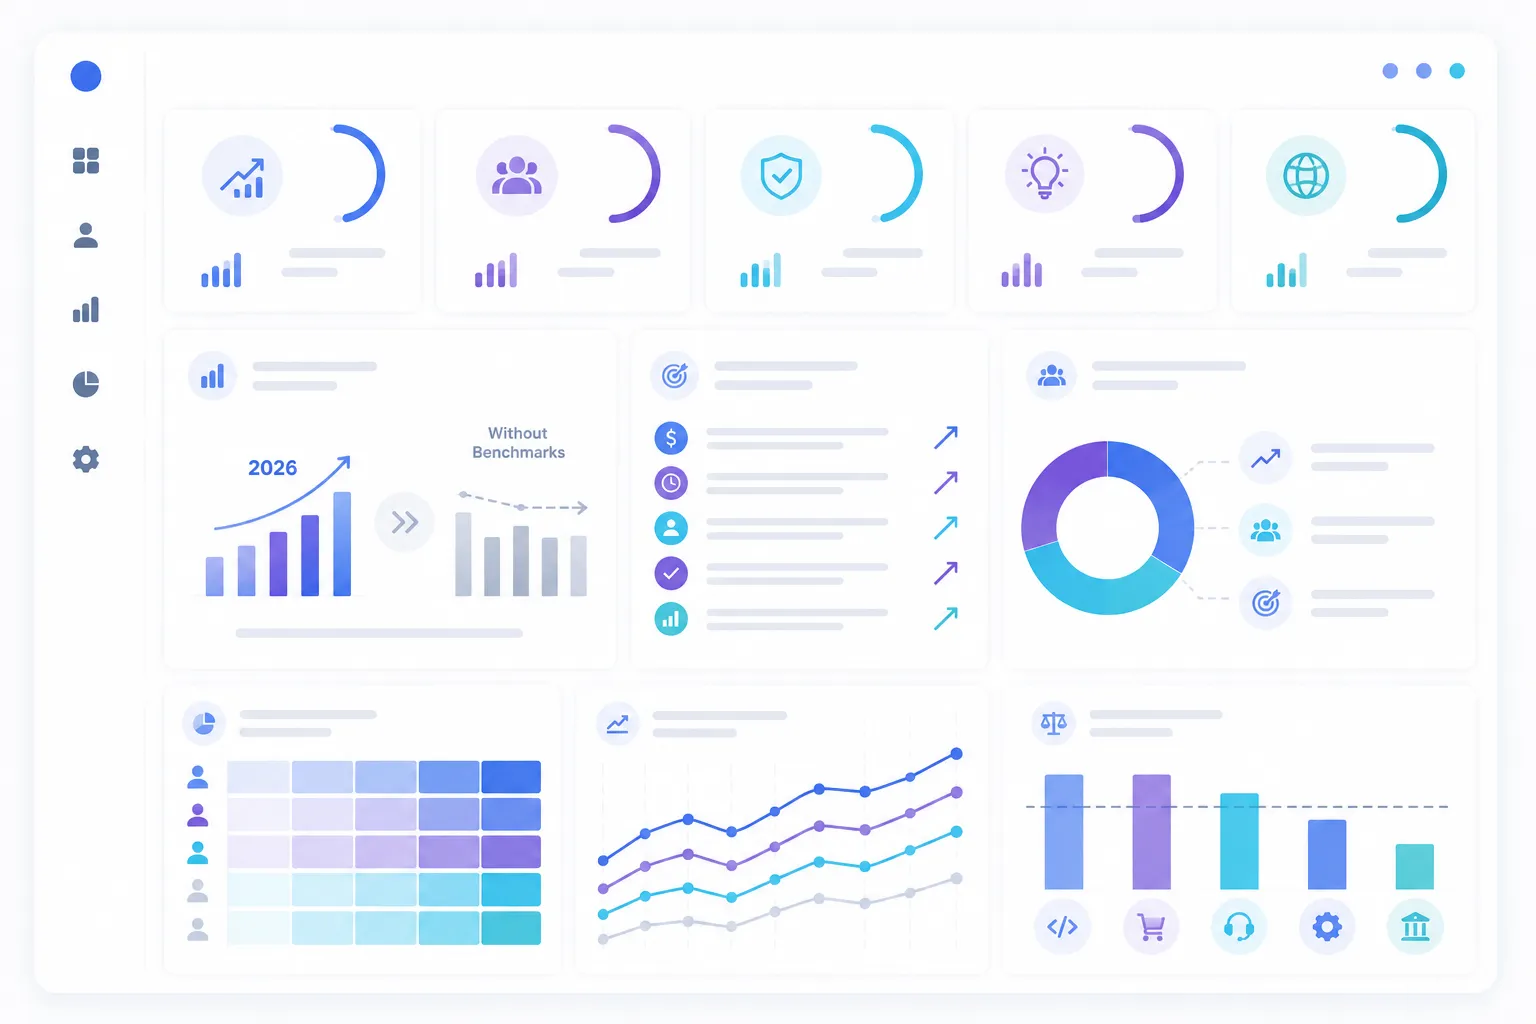
There has been a rapid transformation in the way work is performed over the past couple of years. AI tools, distributed teams, and constant digital communication have transformed how the typical workday occurs. Many traditional productivity measurements - such as hours worked or tasks accomplished - were developed for a workplace that no longer exists for most organizations.
One large study conducted in 2026 concluded that nearly all executives do not trust the performance data used to make decisions, although employee engagement globally declined to historically low levels resulting in $438 billion in annual lost productivity.
Simultaneously, gross output did increase. Employees are working longer hours today than they were a few years ago; however, employees are spending less time focusing on their work.
That combination - more hours working and fewer hours focusing - is precisely why raw productivity percentages are often misleading unless industry-specific comparison is made.
Reading Productivity Benchmarks Correctly
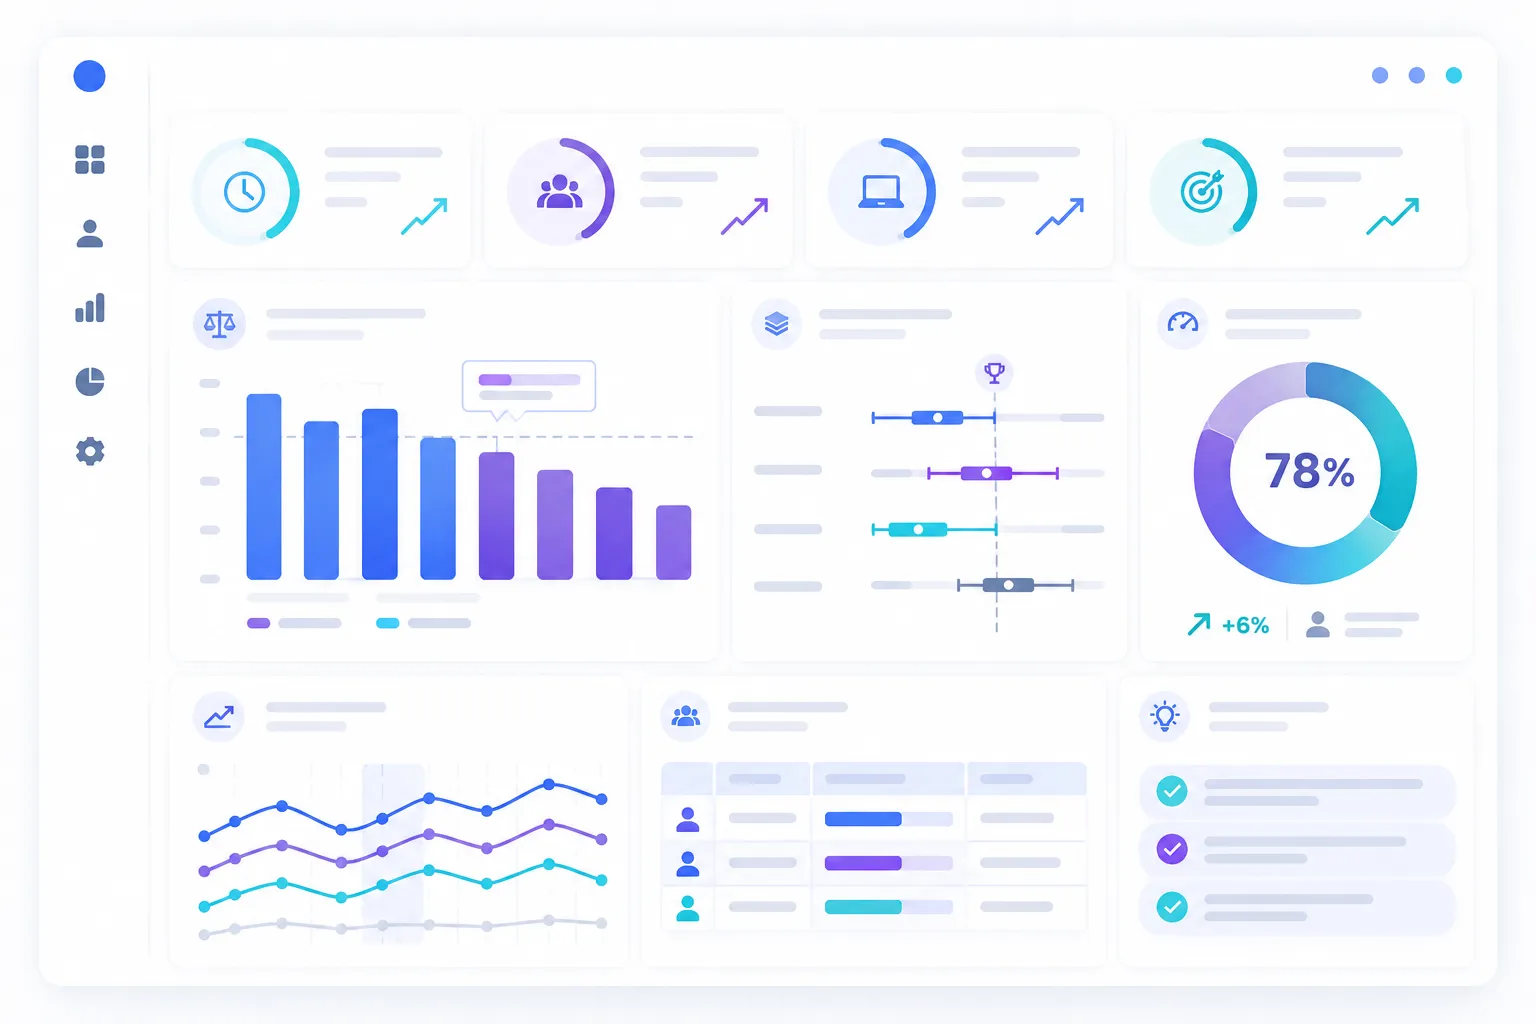
Productivity scores are meant to serve as reference points -- not judgments. While a team that produces at a level below the industry median may indicate poor performance, it may also indicate that the role typically requires more coordination, documentation, or customer-facing time that does not appear clearly in a productivity rating.
More importantly, the right question is not "Are we better/worse than average?" Rather, it should be "What explains our number? Does that align with how this team really operates?"
In comparing benchmarks across departments, functions, etc., they are most effective when compared within those areas. Furthermore, when comparing benchmarks for teams of the same size (small vs. large), there are generally different focus patterns and coordination requirements.
Using this understanding, below is an explanation of how the 2026 data relates to common functional groups.
Sales Teams: High Idle Times -- Not Lacking Effort
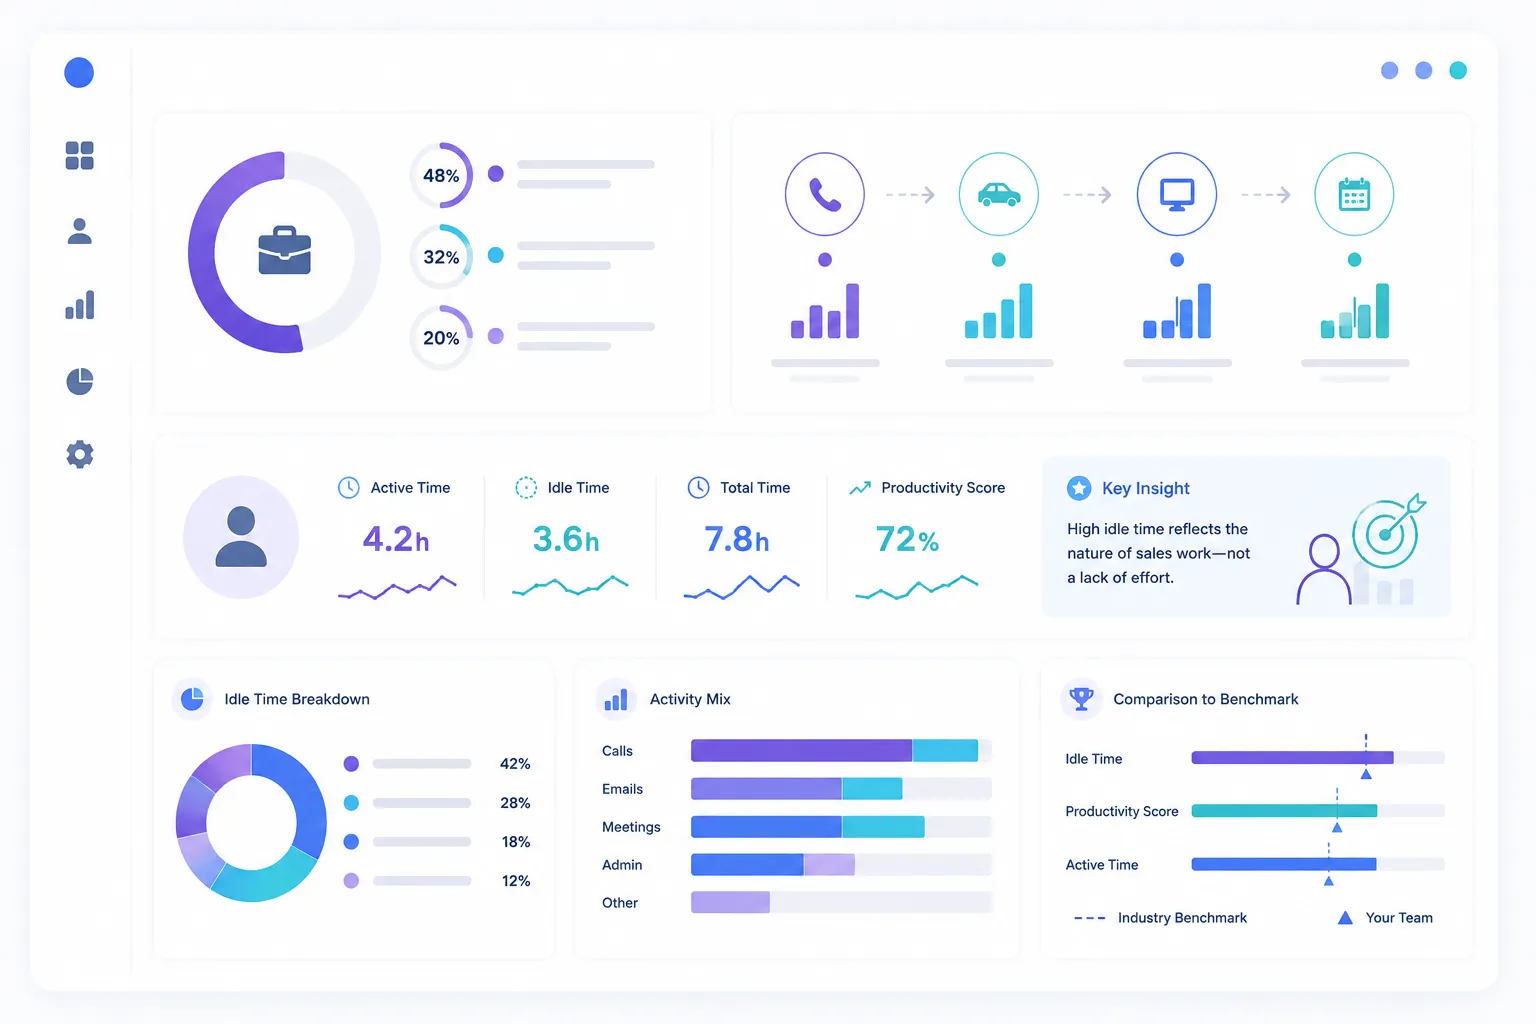
When it comes to sales functions, raw productivity numbers can sometimes be misleading. According to the 2026 benchmark data, idle time for sales teams averages over sixty percent. On the face value, this appears to be indicative of disengagement problems. However, this is generally not true.
Meeting load drives idle time rather than disengagement. Sales roles consist of calls, follow-up communications and pipeline review sessions that result in natural gaps in activity that appear unproductive in reports tracking activity but are a typical component of how the role performs.
Therefore, for sales leadership, the important benchmark question is not simply whether idle time exists. The question is whether idle time is dispersed throughout the day in ways that support sales activities or if it represents calendars loaded with internal meetings leaving no opportunity for rep outreach.
Marketing Teams: Leaders in AI Adoption; Also Highest Burn-Out Risk
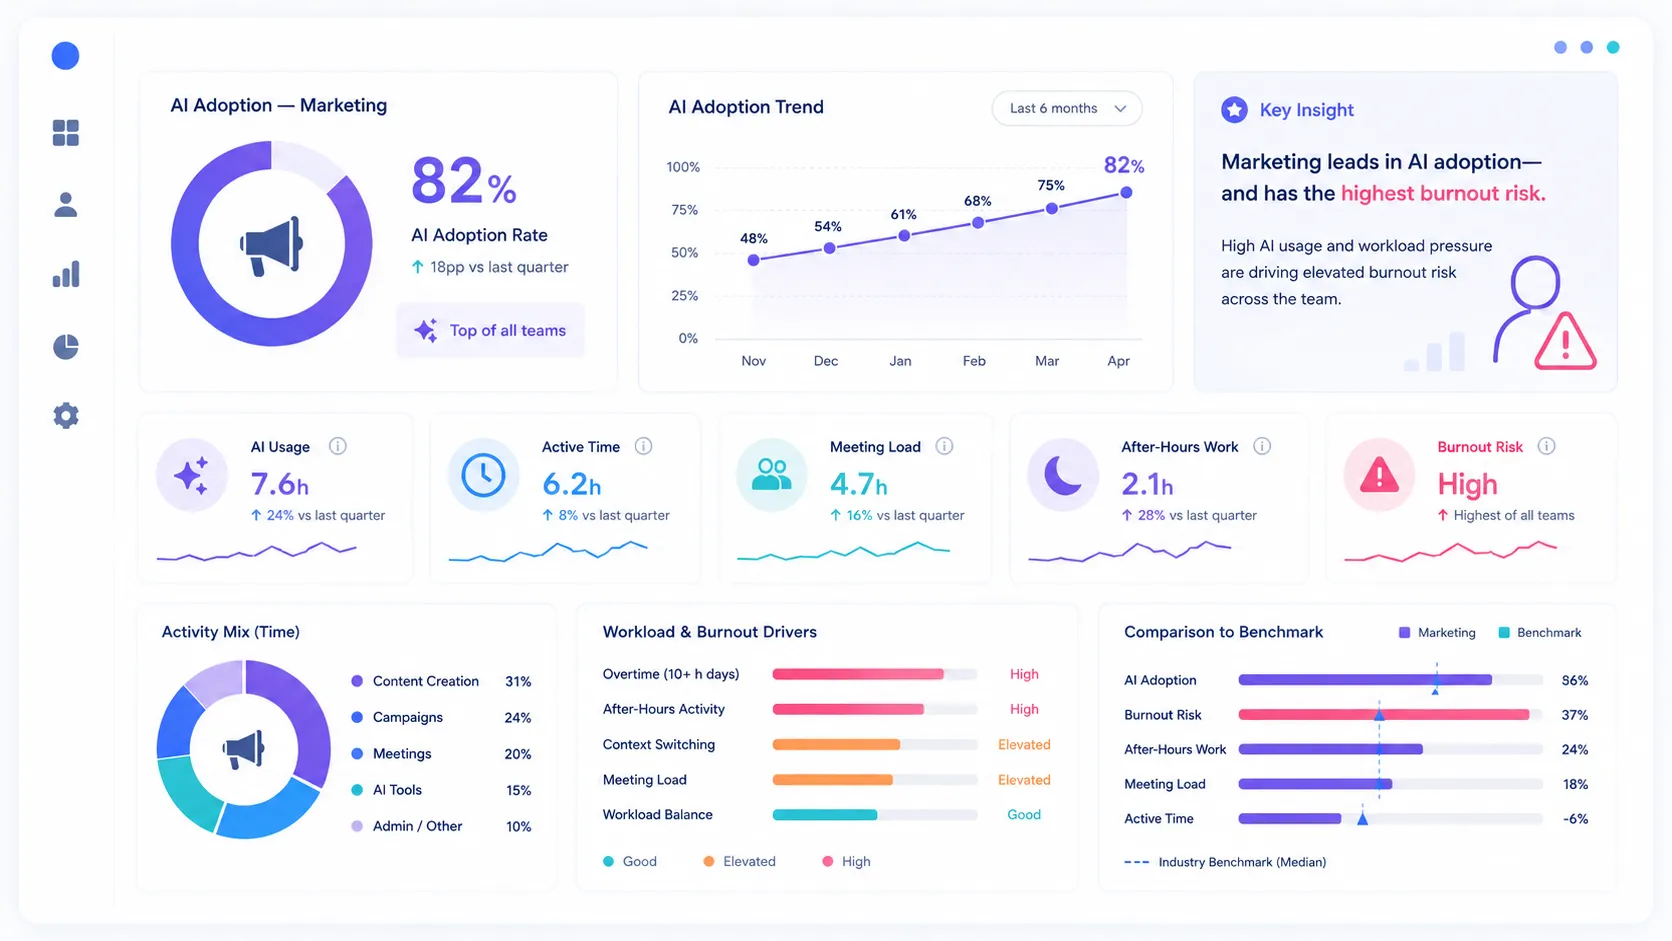
Marketers have rapidly become one of the leading adopters of AI technologies in workplaces. As such, the 2026 benchmark data reveals that marketers also exhibit the highest burn-out risk among all functional areas examined. There is an apparent relationship between these two trends.
Marketers' speed expectations continue to grow, coupled with ongoing campaign turnarounds and ever-present demand for content creation can drive teams into continuous overwork despite their ability to complete tasks quicker than previously.
It is also beneficial to remember that adopting AI technologies alone does not constitute a productivity strategy. A marketing team producing content twice as quickly but working twice as many off-hour sessions may not be a healthier or more sustainable organization than it was prior.
Finance & Compliance Functions: High Outputs; Document-Heavy Workload
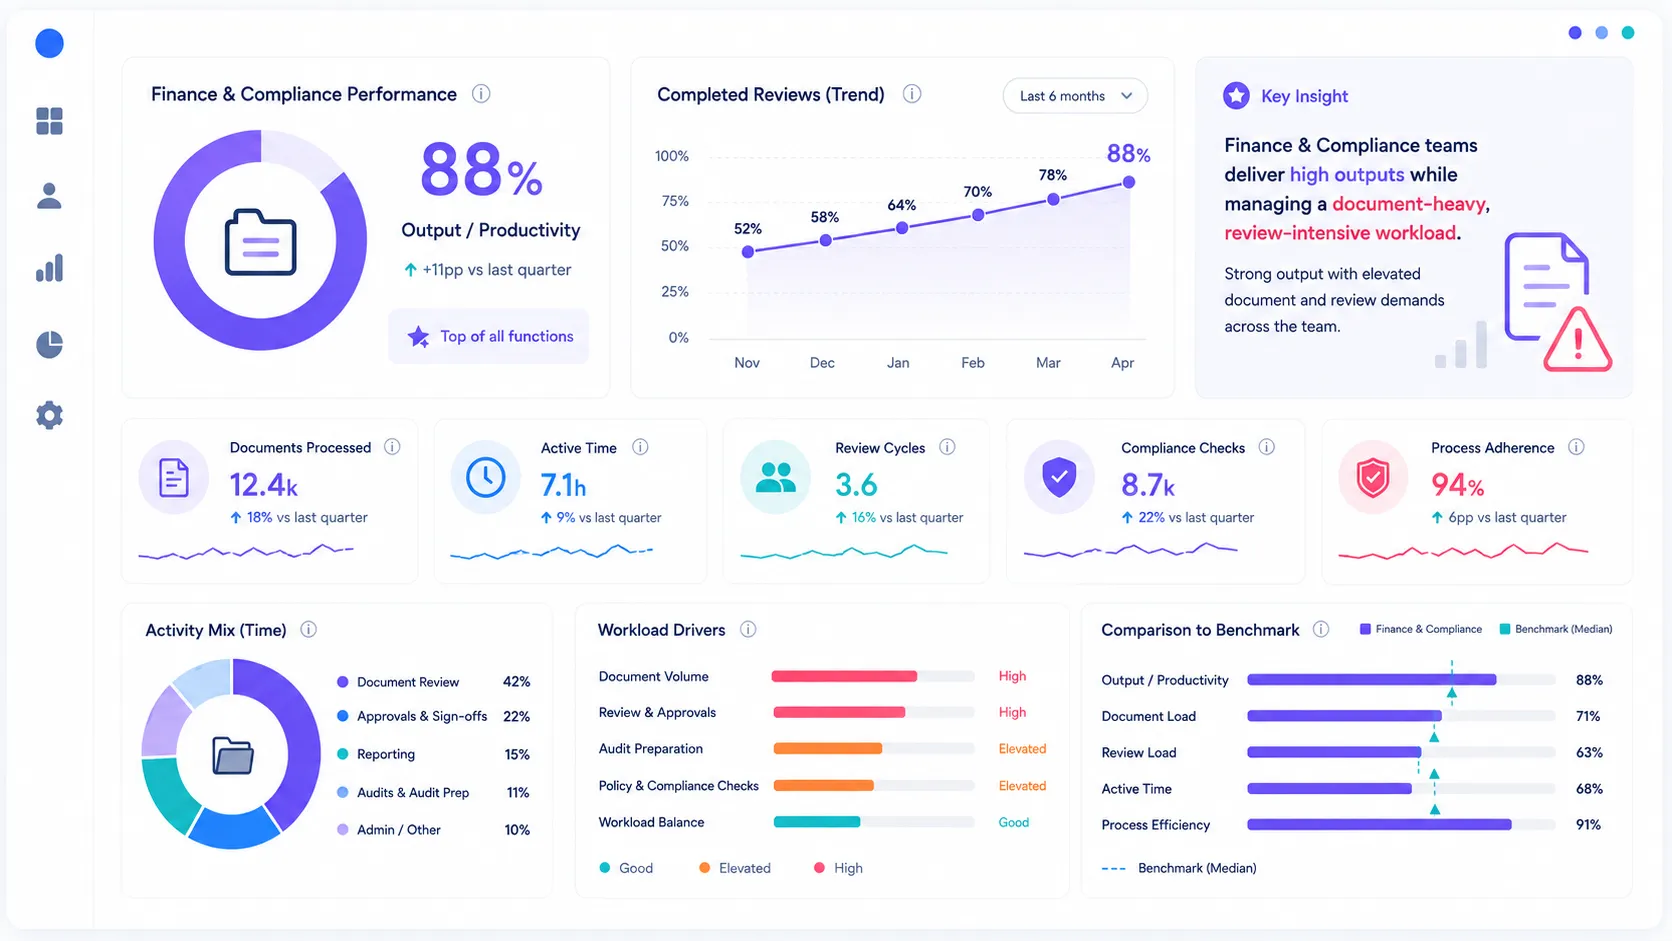
Finance teams exhibited some of the highest raw productive-time numbers in the 2026 data - including values near 90% - while utilizing AI tools significantly less than other functions. This trend is expected considering the nature of work involved.
Finance and compliance roles include structured documentation-intensive tasks that track well to active screen time. Regulatory environments surrounding financial reporting allow less flexibility for experimentation with tools as seen with marketing or sales.
Healthcare Administration exhibits similar characteristics for comparable reasons. Compliance documentation and meeting-driven coordination lead to lower productive-time ratios for healthcare administration than transactional queue-based roles despite equivalent amounts of required work.
Customer Service/BPO: Structured Processes Drive Productive-Time Ratios
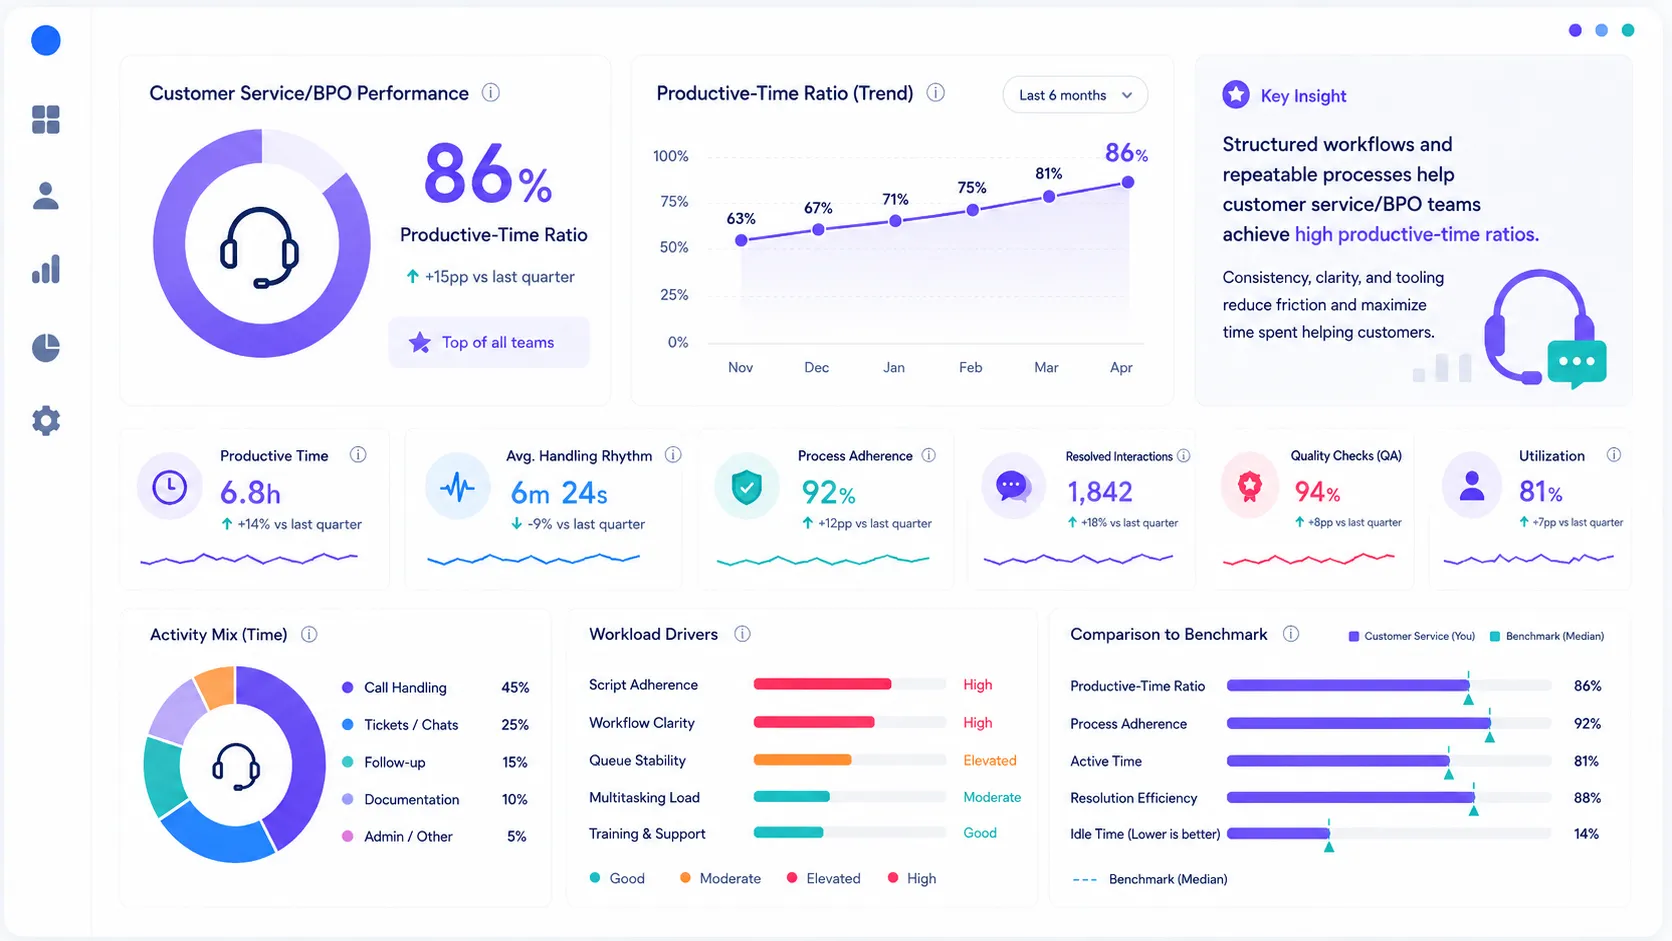
Customer service and BPO operations produce some of the highest productive-time ratios as determined by benchmark data collected during 2026. The reason for this is that both types of operations have task-oriented processes with limited meeting overhead.
The average handle times in 2026 were around six minutes for voice interactions and less than five minutes for chats, with first contact resolutions averaging in the low seventies across the industry.
The risk associated with these types of operations is not inactive periods. It is the opposite. Teams demonstrating productive-time ratios exceeding 80% for extensive periods demonstrate higher attrition than teams functioning at moderate levels indicating burn-out slowly develops behind seemingly positive numbers.
Interestingly, top performing support teams do not skip breaks more than others. Top performers tend to take slightly more breaks than average while having lower levels of unproductive time than other teams supporting this notion that rest and output are competitive interests.
Software & Engineering Teams: Focus Time determines productivity
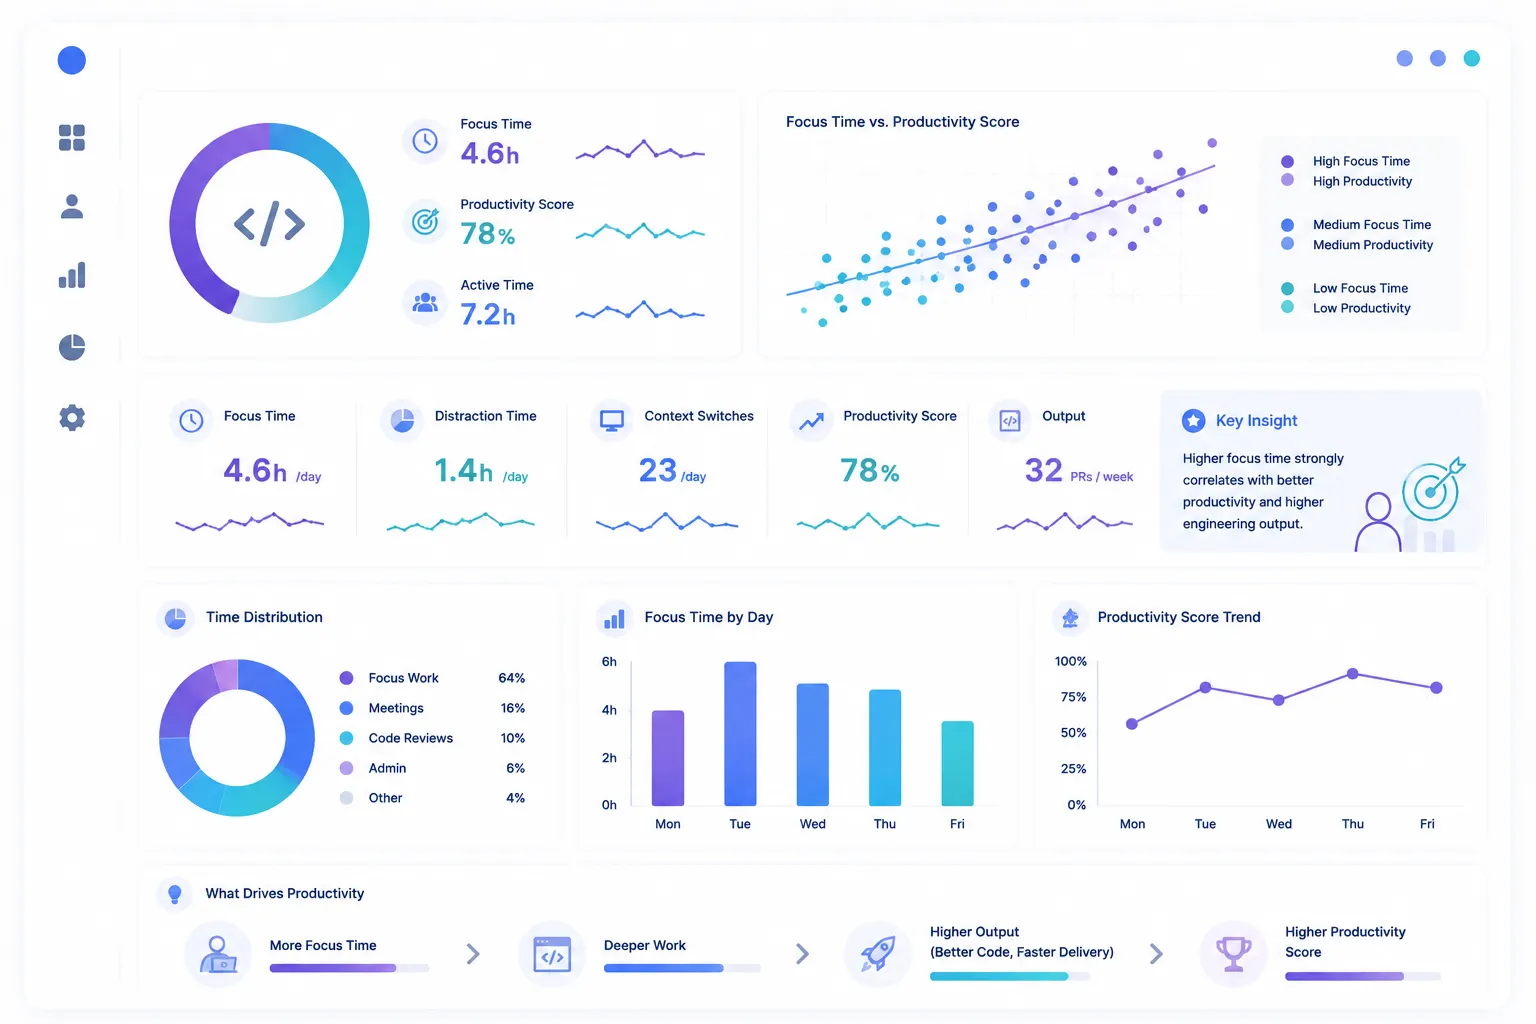
Engineering is probably the best illustration of why activity percentages alone do not give you the complete picture of productivity. In terms of overall productivity and unproductive-time, it and Engineering Teams typically fall at the top end of all functions, yet only about 12% of total hours worked are spent collaborating.
This creates a real possibility of developing knowledge silos, despite high individual output, and therefore Focus Time is the key metric here. While median Engineering Teams receive approximately 4 hours per day of Focus Time; top performing teams consistently protect 6 hours or more of uninterrupted deep work.
In addition to having more Focus Time, these teams will also experience shorter pull request cycle times and fewer defects than teams that do not offer this type of time (assuming teams work equivalent hours). Each unplanned disruption experienced by a developer results in lost time for him/her to recover from, beyond the duration of the disruption itself, which is why fragmented calendars quietly reduce engineering output more so than they do in other types of roles that rely less on Focus Time.
While AI coding assistants are widely used in engineering, the adoption of AI coding assistants has not resulted in a completely positive impact on productivity. Issues related to AI generated code changes are resulting in significantly more problems and longer review cycles for AI generated code compared to code written by developers. This serves as a good reminder that increased speed/production and quality/accuracy are not always synonymous.
Location creates a gap between Remote/Hybrid and on-Site work where employees work is continuing to appear in our benchmark data. Employees working remotely reported much greater employee engagement than employees working in Hybrid/non-Remote capable on-Site settings. Employees working remotely also logged a greater percentage of their work day in deep focus compared to their Hybrid counterparts, which is likely due to the fact that there are simply fewer ambient distractions in a home office compared to an open floor plan.
It doesn't mean that Remote work is inherently better suited to every function. It means that location impacts the amount of time spent engaged in deep focus during the work day, and Benchmarks need to consider that reality rather than comparing a fully Remote Software development team to an on-Site retail operations team using the exact same measuring stick.
Benchmark patterns continue to shift due to increased use of AI tools
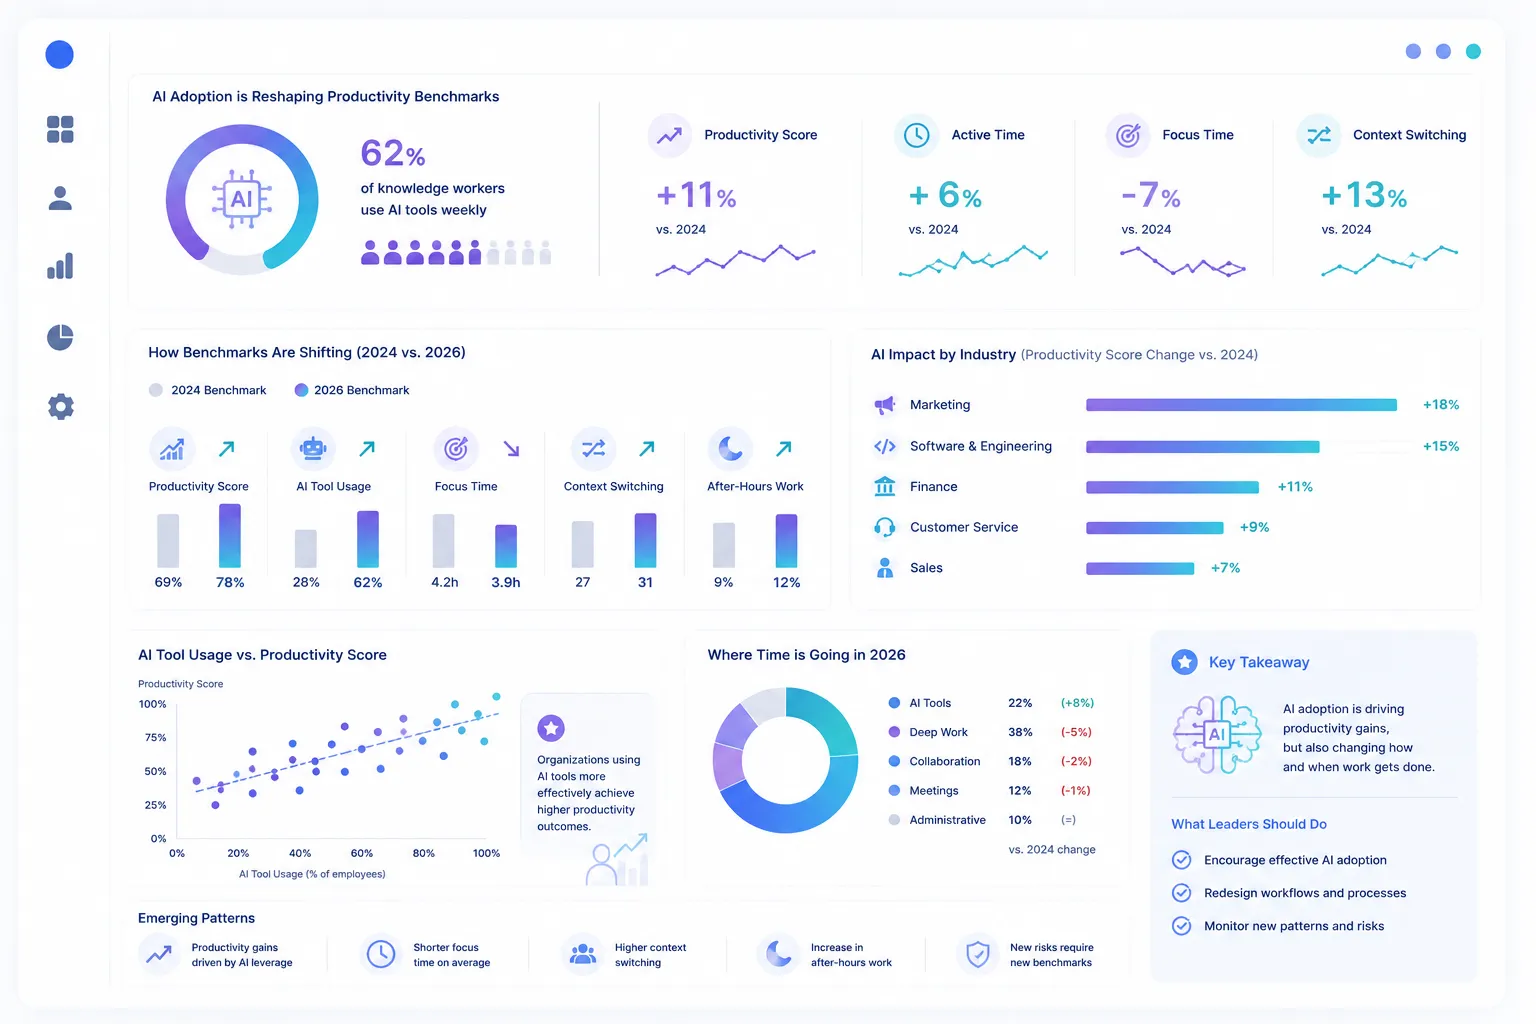
Use of AI tools is becoming a factor in nearly every productivity benchmark we've studied, and the trend is consistent across functions. Generally speaking, employees who spend a moderate amount of their time utilizing AI tools (approximately 7-10% of total work hours) tend to be more productive than colleagues who either rarely utilize AI tools or heavily depend upon them.
As previously mentioned, over-reliance on tools requiring review/correction may indicate over-reliance, while minimal utilization generally indicates missed opportunities for enhanced efficiency.
As stated earlier, this is a dynamic benchmark. What was considered heavy AI usage at the beginning of 2026 already appears different in mid-year 2026. As such, static comparisons made once will continue to lose relevance as AI usage evolves.
Using Controlio to create a 2026 benchmark report
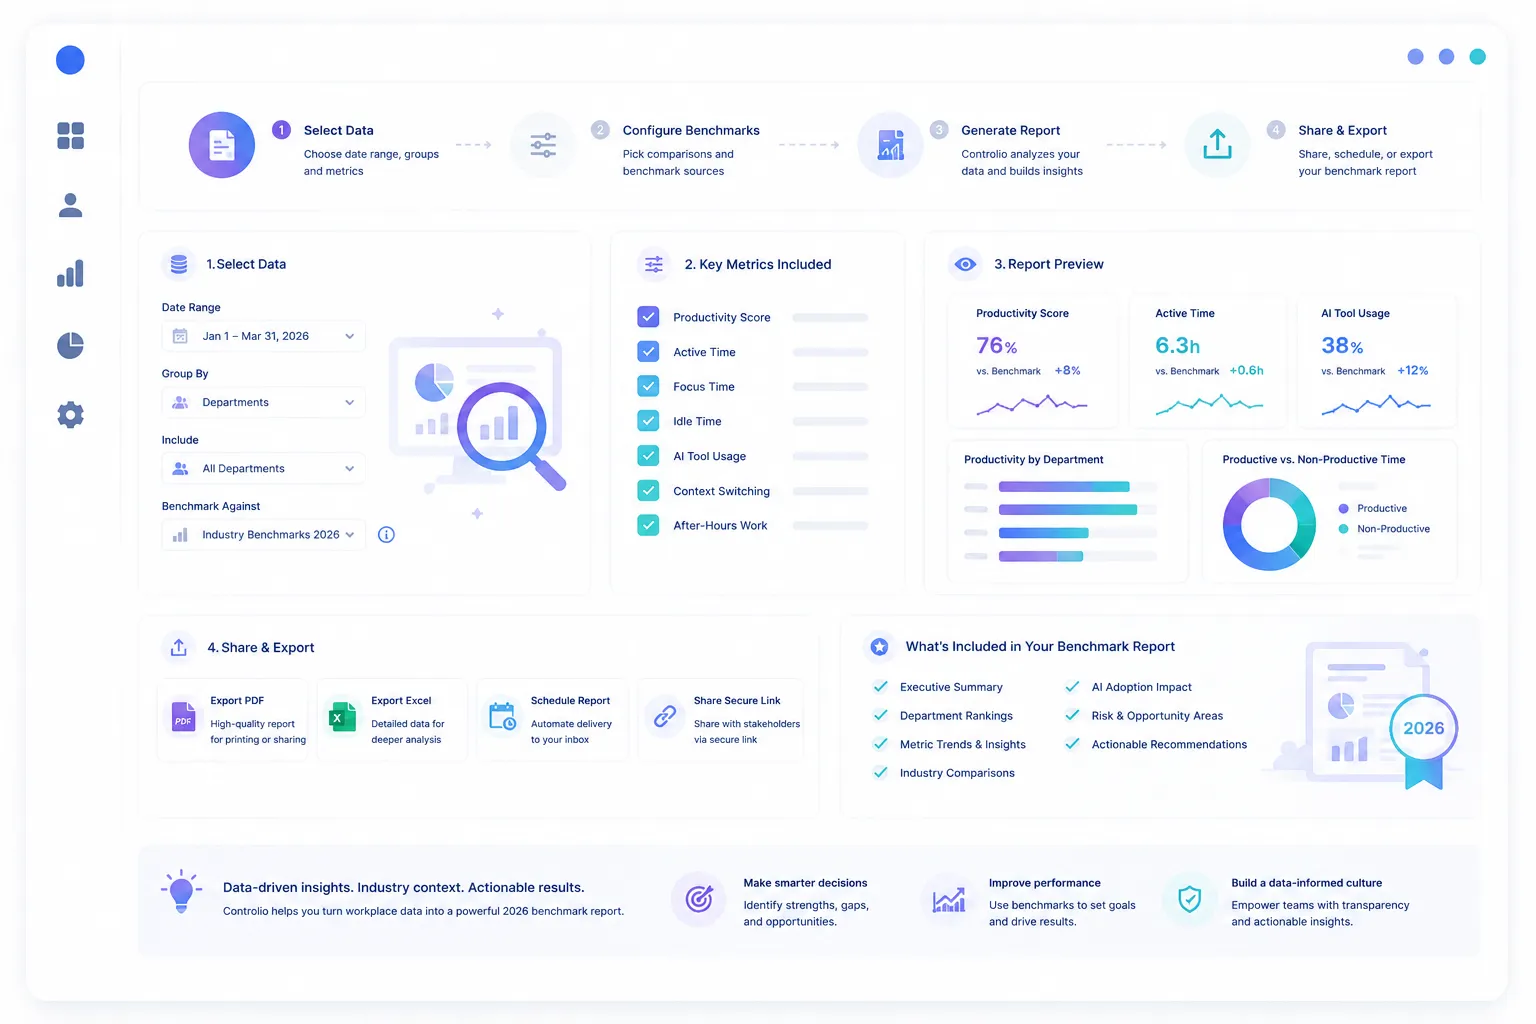
While public benchmark studies provide insight into commonality among industries/function-specific productivity patterns, they fail to provide Managers with meaningful insight regarding what is occurring within their own teams. By converting ordinary workforce data into a comparable and continuous benchmark, Controlio enables Managers to create a comparative benchmark of their own workforce data (as opposed to obtaining a snapshot of productivity).
Instead of speculating about the reasonableness of a team's productive-time ratio for the corresponding role, Managers can continuously monitor productivity trends through the lens of individuals, departments, and defined time frames. Additionally, Controlio's employee monitoring software provides Managers with the ability to analyze trends relative to the nature of work performed by each department.
Through behavioral analysis and computer monitoring software, Managers can identify whether a decline in productivity correlates with a busy meeting schedule, new tool rollout, etc., providing Managers with actionable information to address productivity declines.
In addition to tracking productivity trends, work time logging also allows Managers to determine if hours worked are being converted into focused productivity or absorbed into fragmented, lower value activities. Taken collectively over a full quarter/year, this creates an internal benchmark report representing how work occurs within a particular company vs. what a global average would suggest it should look like.
Converting Benchmarks into actionable management decisions
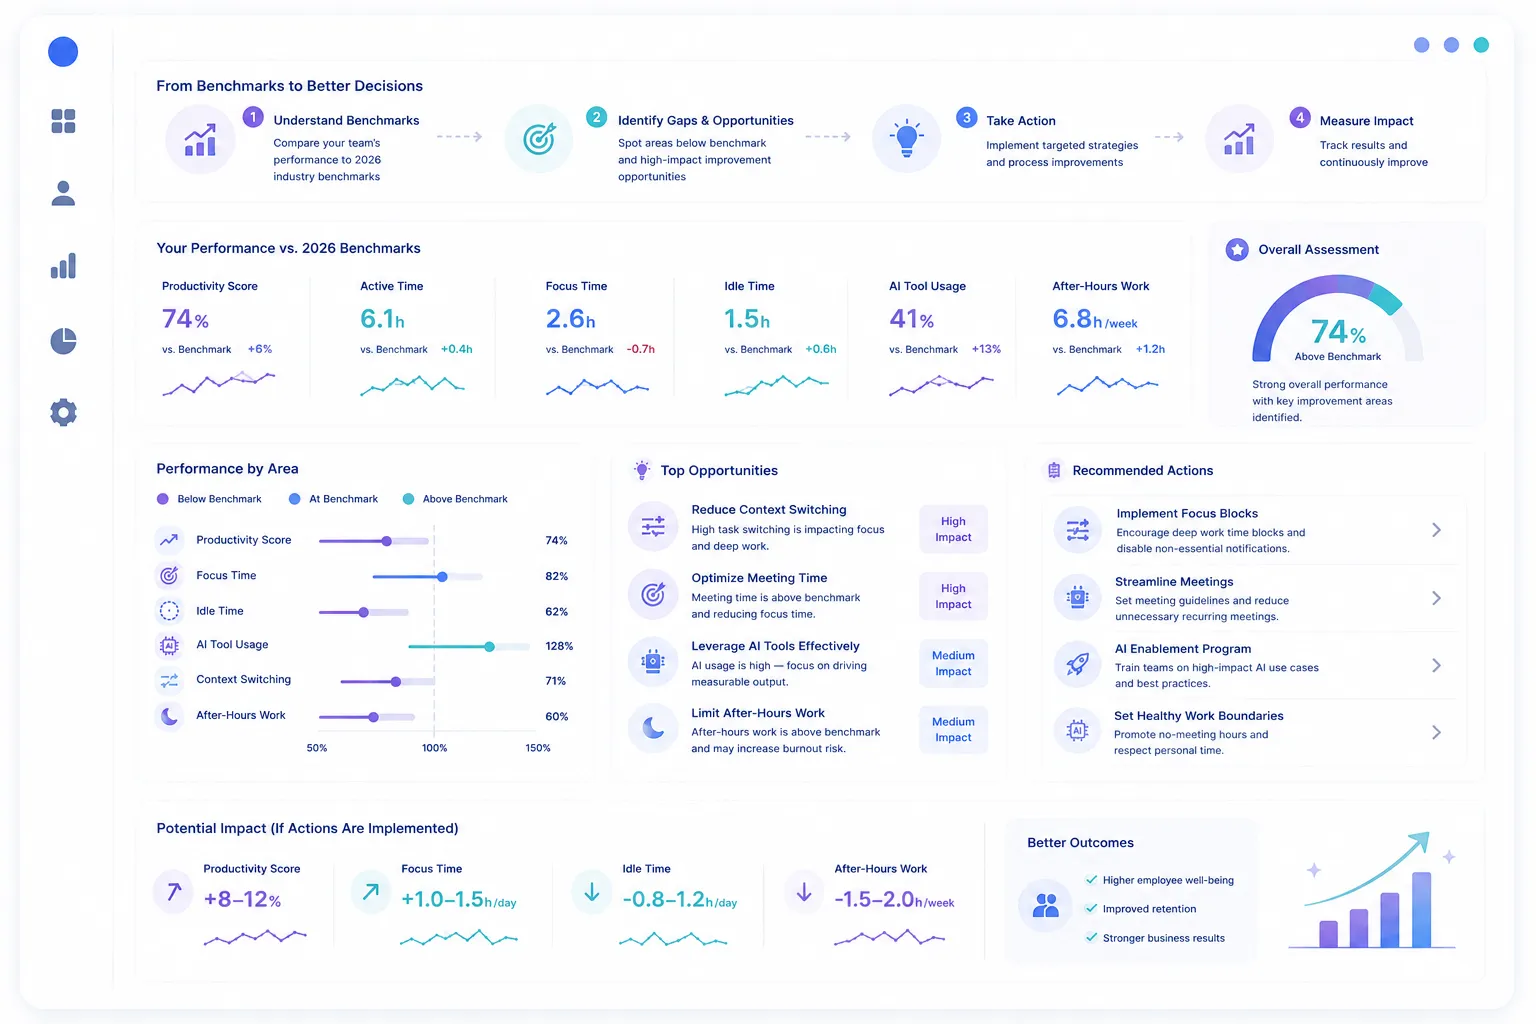
A benchmark is only helpful if it leads to dialogue-not judgment. A team scoring below the sales idle-time benchmark is not automatically failing; nor is a team scoring above the engineering focus-time benchmark automatically free from burnout risks. The number represents an opportunity for Managers to begin asking better questions.
When Managers incorporate qualitative aspects along with quantitative indicators into their decision-making processes (much like top performing teams in the 2026 study), they derive the greatest value possible from benchmark data. For example, a decrease in productivity could indicate a process failure; likewise, an increase in after-hour activity could signify an unreasonable deadline. A benchmark cannot independently address these questions-but can direct Managers to investigate further.
Summary
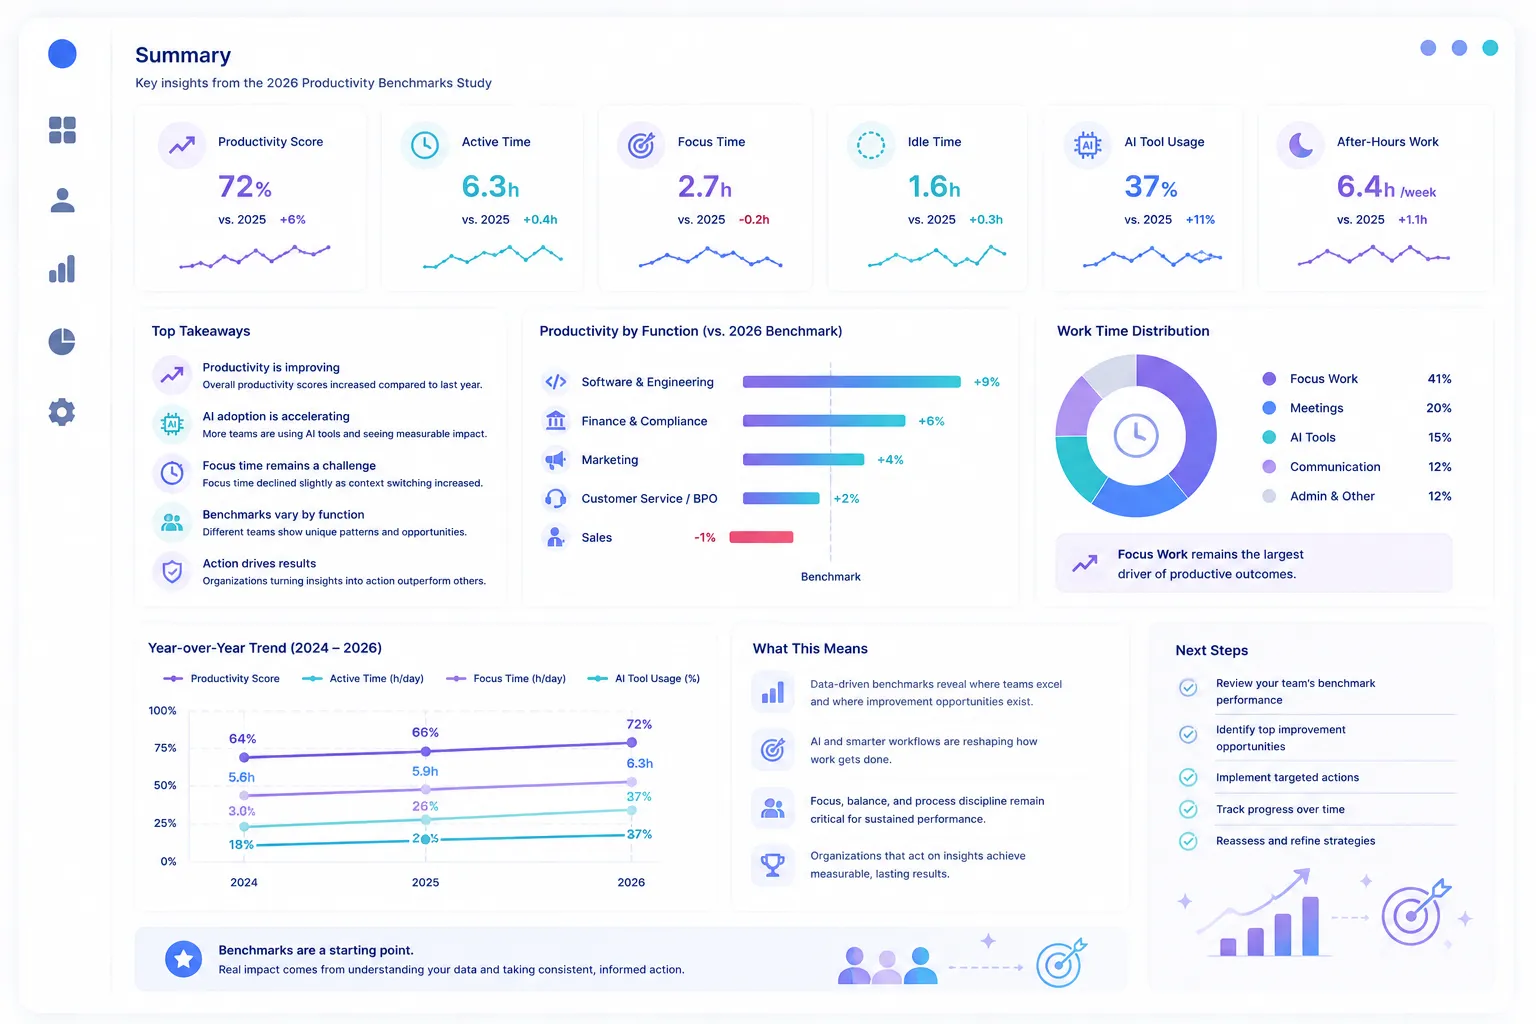
Comparative productivity Benchmarks are only relevant when interpreted within proper context. Sales teams will inherently have more idle time than finance teams.
Engineering output will be influenced far more by protected time for focus than by actual hours worked. And, Remote and on-Site employees exhibit differing levels of engagement for reasons unrelated to effort. None of these factors can be discerned from one broad productivity score applicable across all departments.
The 2026 data clearly illustrates that comparing a team against the correct industry standard (not against the general average) is required to transform a productivity figure into something that is actionable by management. Controlio equips organizations with timely and continuous data necessary to develop comparative metrics for their respective workforces on an ongoing basis-rather than solely relying on an externally produced one-time study that may not accurately represent how their teams operate.
Frequently asked questions
What workforce KPIs should organizations compare with employee productivity benchmarks?
Organizations should compare productivity benchmarks with workforce KPIs such as focus time, collaboration patterns, meeting load, productive-time ratios, employee efficiency, and operational productivity to understand why performance changes occur rather than relying on a single metric.
What are employee productivity Benchmarks?
Employee productivity Benchmarks refer to comparative standards (typically developed from large pools of workforce data) illustrating representative productivity ranges existing across an industry/job function. These serve as alternatives to gauging performance by arbitrary productivity figures.
Why does productivity benchmark data differ significantly across different industries?
Industry differences occur due to the inherent differences found between various job functions including level of collaboration; meeting frequency; regulatory/compliance requirements; and/or degree of independent/dependent tasks. For example-a queue-based support role and a regulatory-compliant finance role will display vastly disparate productive-time ratios regardless of whether both teams are actively producing output.
How can Managers effectively utilize productivity benchmark data?
Benchmark data is effective when utilized as a starting point for discussions rather than as definitive evidence of performance. When employee productivity falls outside normal parameters, it is merely a signal prompting inquiry as to potential causes contributing to decreased productivity-productive time ratios such as increasing meeting loads; newly implemented workflow tools/processes; changing workloads; etc.-rather than conclusive evidence that a team is underproducing.
Is moderate usage of AI tools associated with improved productivity metrics?
Moderate amounts of AI tool usage are positively correlated with improved productivity across numerous functions. However-the relationship between moderate AI tool usage and improved productivity is not directly proportional. Minimal use of AI tools generally misses opportunities for enhanced efficiency, whereas excessive dependency on tools requiring manual review/corrections can introduce additional error/re-work (especially within technical roles).
Can Controlio assist organizations in creating their own internal productivity Benchmarks?
Controlio cannot supplant industry-wide studies; however-it can assist organizations in creating internal benchmark studies based upon their own workforce data. Productivity trends; workload reporting; and behavioral analysis enable Managers to measure productivity comparisons across departments/timeframes using data reflecting how their organization operates internally.